European Union legislation sets air quality standards both for the short-term (hourly/daily) and long-term (annual) air quality levels: standards for long-term levels are necessarily stricter than for short-term levels, because serious health effects may occur from long-term exposure to such pollutants. Under EU law a limit value is legally binding, for a target value the obligation is to take all necessary measures not entailing disproportionate costs to ensure that it is attained, and so it is less strict than a limit value.
Directive 2008/50/EC introduced additional PM2.5 objectives. These objectives are set at national level and are based on the average exposure indicator (AEI). This is determined as a 3-year running annual mean PM2.5 concentration averaged over the selected monitoring stations in agglomerations and larger urban areas, set in urban background locations to best assess the PM2.5 exposure of the general population.
The regulations on air quality in Ireland are based on European Union CAFE regulations (Ambient Air Quality and Cleaner Air for Europe Directive 2008/50/EC) published in May 2008 and the fourth Daughter Directive (2004/107/EC)- collectively referred to as the AAQD. These were transposed into Irish Law by the Air Quality Standards Regulations (S.I. 180 of 2011) and the Arsenic, Cadmium, Mercury, Nickel and Polycyclic Aromatic Hydrocarbons in Ambient Air Regulations (S.I. 58 of 2009). They rely on defined limits, over specified periods, for concentrations of certain pollutants. The ones relating to the AQIH are listed below:
Sulphur Dioxide:
WHO guidelines (2005) are significantly lower than the CAFE limits at 20μg/m3 per 24-hour mean instead of 120μg/m3. It was found that people with asthma can exhibit symptoms after ten minutes of exposure, so a 500μg/m3 10-minute mean was included. Much lower levels of SO2 than previously thought can cause harm.
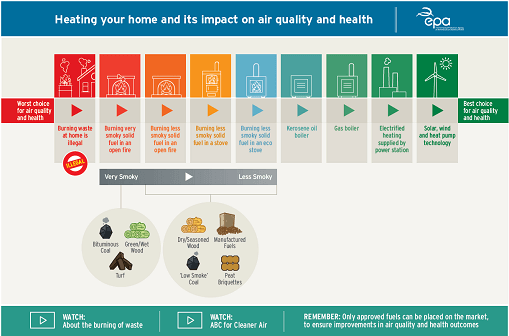
Sources of SO2 include burning coal and oil. It is a colourless irritant gas that irritates the eyes, attacks throat and lungs. It aggravates asthma and chronic bronchitis. When levels are high the number of hospital admissions for cardiac disease and mortality increase. It contributes to acid rain. Levels are usually low to moderate in Ireland and have dropped due to “smokeless” coal (low sulphur), more use of natural gas and reduced emissions from industry through IPC licencing. The ban on the sale of smoky coal was first introduced in Dublin in 1990 before being extended to larger towns. This is due to be expanded to a nationwide ban for all of Ireland in Autumn 2019.
Nitrogen Dioxide:
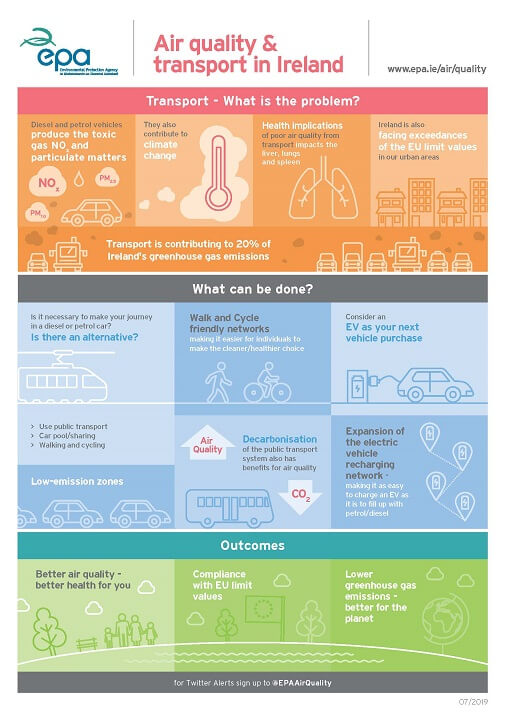
WHO guidelines (2005) are the same as the CAFE limits at 40μg/m3annual mean & 200μg/m31-hour mean. The major sources of NO2 are combustion - car and ship engines, electricity generation and industry. It is a toxic gas that effects throat and lungs by inflaming the lining causing respiratory problems. It can cause emphysema, bronchitis and cellular damage. People with asthma, young children and older adults have an increased sensitivity to its effects. NO2 can combine with particles in the air to form a reddish-brown haze over cities, like the brown smog over Cape Town in winter or Los Angeles in early Autumn (Walton, 2005). Oxides of nitrogen (NOx) can contribute to the formation of acid rain, form an important fraction of PM2.5 and, in the presence of UV light, form low level ozone which causes breathing problems and can trigger asthma. In atmospheric chemistry, the term NOx denotes the total concentration of NO and NO2 which convert back and forth in the presence of sunlight. At the point of emission (i.e. the exhaust pipe), the proportion of NOx is around 90% NO and 10% NO2. After a few hours in the atmosphere and in the presence of volatile organic compounds (VOCs) the NO is converted to NO2. This reaction can occur over a couple of seconds to a few hours. NO2 reacts further with other substances in the air to form nitric acid, particulate matter and substances called PANs (peroxyacyl nitrates).
Also with sunlight NO2 can convert back to NO and produce ozone (O3) as a "secondary" pollutant. During daylight hours these concentrations, together with that of ozone, are in steady state, also known as photostationary state (PSS); the ratio of NO to NO2 is determined by the intensity of sunshine (which converts NO2 to NO) and the concentration of ozone (which reacts with NO to again form NO2). In areas where road vehicles are the main source of NOx there is often higher NO2 concentrations during peak traffic times such as around 9am and 5pm weekdays. Ozone (O3) concentration increases during the day while the NO2 concentration decreases. After 6pm, the NO2 concentration builds up as there is no sunlight to convert NO2 back to NO. There are also natural sources of NOx emissions such as wildfires and lightning strikes (9% in US) but most is caused by human activity.
There was an exceedance of the annual limit value for NO2 at the St Johns Road West monitoring station in Dublin, in 2019.
Particulate Matter:
Particulate matter (PM10 and PM2.5) is often used to represent air pollution as it affects everyone. There is a close, quantitative relationship between exposure to high concentrations of small particulates (PM10 and PM2.5) and increased mortality or morbidity, both daily and over time (WH Organisation, 2016). Conversely if PM levels are reduced in a city then mortality is also reduced.
PM is made up of sulphates, nitrates, ammonia, sodium chloride, black carbon, mineral dust and water suspended in the air. They are a main cause of pollution haze or smog. There are many sources of particulate matter (dust) including vehicle exhaust emissions, soil and road surfaces, construction works and industrial emissions. Particulate matter can be formed from reactions between different pollutant gases.
Small particles can penetrate the lungs and cause damage. These are known as PM10 (diameter less than 10µm). PM2.5 (diameter less than 2.5µm) can penetrate the lung barrier and enter the blood stream. PM1 and smaller may cross the brain barrier.
There are high levels of PM10 in many cities and towns. In smokeless fuel zones, set up in Ireland in the 1990’s, levels of particulate matter decreased after a ban on household burning of bituminous coal. WHO AQG values are set for coarse Particulate Matter (PM10) at 20μg/m3 annual mean and 50μg/m3 24-hour mean.
PM2.5 WHO AQG is 10 μg/m3
annual mean & 25μg/m3 24-hour mean,
(CAFE limits are twice the WHO annual means)
but there is no safe threshold value for PM. In European cities where PM concentrations comply with guideline levels, it is estimated that average life expectancy is 8.6 months lower than it would otherwise be, due to PM exposures from human sources (WHO, 2018).
Carbon Monoxide:
The main source of carbon monoxide (CO) is traffic – incomplete combustion of carbon-based products. Carbon monoxide concentrations inside vehicles are generally higher than those measured in ambient outdoor air and higher levels can be encountered in car parks and tunnels. CO is absorbed faster than oxygen as the affinity of haemoglobin for CO is 200–250 times that for oxygen. This can cause tissue damage and heart attacks. The effects are amplified during pregnancy. WHO (WHO, 2000) set guidelines at 30,000μg/m3 for 1 hour & 10,000μg/m3 for 8 hours, which is the same as the CAFE limit for 8 hours. Levels in Ireland are low.
Ozone:
Ozone is a natural component of the atmosphere. Most ozone is found high up in the stratosphere, the layer of the atmosphere between 12km and 50km above sea level. Stratospheric ozone is essential to life on earth as it protects us from harmful rays from the sun.
Ozone is also found in the troposphere (ground level), the layer of the atmosphere next to the earth. Exposure to high concentrations of tropospheric ozone causes chest pains, nausea and coughing in humans. Long term exposure to moderate concentrations reduce lung capacity and can worsen heart disease, bronchitis, emphysema and asthma. Ground level ozone contributes to the greenhouse effect and global climate change. Levels of ozone in Ireland are moderate.