Clean Air Together Waterford City – The Results. 300 citizen scientists find low level of pollution from traffic across Waterford City
Date released: March 06, 2026
- Clean Air Together Waterford gives a snapshot of nitrogen dioxide (NO2) levels, a traffic-related air pollutant, across Waterford city and environs.
- In 2025, over 300 citizen scientists in Waterford helped take samples of air to measure levels of nitrogen dioxide (NO2) in their local areas, as part of the Clean Air Together project.
- 85 per cent of locations returned results in the lowest category for NO2, with another 14 per cent in the next lowest category.
- Higher results were found along some of the busiest roads in Waterford City such as Meagher’s Quay, Merchants Quay and Summer Hill.
- The results will be used by the EPA to help model air quality in Waterford City and support evidence-based planning and action by the Council on how people live and move around the city.
05 March 2026: In 2025, over 300 citizen scientists measured levels of the harmful air pollutant, nitrogen dioxide (NO2), in Waterford city and environs as part of the Clean Air Together Waterford project. Results from the study were presented to the people of Waterford at a public event hosted in SETU Campus. This large-scale citizen science project was led by the Environmental Protection Agency (EPA), in partnership with Waterford City and County Council, and with support from Kilkenny County Council and the Environmental Education Unit of An Taisce.
Commenting on the project, Patrick Byrne, EPA Director, said:
“Clean Air Together Waterford has been a great success, with hundreds of citizen scientists in the city measuring the levels of traffic pollution in their local areas. This campaign has given us all a very valuable snapshot of nitrogen dioxide levels across Waterford city and environs, and has provided important new data about this air pollutant to complement the EPA’s existing air quality monitoring network. This project would not have been possible without the engagement and commitment of Waterford’s citizen scientists, whose interest in learning about air pollutants and improving their local environment is clearly evident”.
Nitrogen dioxide levels across Waterford and its surroundings were generally low, with 85 per cent of results falling in the lowest NO2 category. 14 per cent of results fell within the next lowest NO2 category . Higher levels of NO2 were found near busy roads in the city centre which can be expected given that traffic is the main source of NO2 in our towns and cities. While higher results measured are within current EU Air Quality limits, these areas will require focus with more stringent air quality limits coming into force from 2030.
Mayor of Waterford, Séamus Ryan added,
“These results are encouraging, with most locations showing low levels of traffic-related pollution, but we cannot be complacent. Where higher readings were identified along busy routes such as Meagher’s Quay and Merchants Quay, we now have clear evidence to guide our next steps. Clean air is not just an environmental issue, it’s a public health issue, and this project gives us the knowledge to protect both.”
The information gathered through Clean Air Together will be used by the EPA to inform its air quality modelling and forecasting. The information will also support evidence-based decision-making by Waterford City and County Council, in areas such as transport and active travel planning, while supporting initiatives aimed at raising awareness and promoting practical actions to address air pollution.
Results from the Clean Air Together Waterford project are available on the Clean Air Together project site.
Further information: Niamh Hatchell, EPA Media Relations Office 053-9170770 (24 hours) or media@epa.ie
Photos from the event on Thursday 5th March are available from the EPA Media Relations Office.
Notes to Editor
Summary of results
The results show the impact of traffic on nitrogen dioxide (NO2) air pollution levels: higher NO2 levels are linked with higher traffic volumes. All results are available on the Clean Air Together project website.
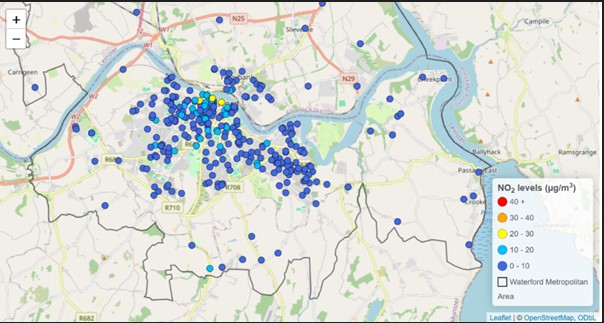
Figure 1: Clean Air Together - Waterford City and environs results map
Clean Air Together Waterford results depicted in the map fall into the following categories:
- Dark blue dots (0 - 10 μg/m3) represent 85 per cent of the measurements.
- Light blue dots (10 - 20 μg/m3) represent 14 per cent of the measurements.
- Yellow dots (20 - 30 μg/m3) represent 1 per cent of the measurements.
Lower NO2 measurements (light blue and dark blue dots) accounted for 99 per cent of the study’s results. 1 per cent of the results were above 20 µg/m3. There were no results obtained in the 30-40 μg/m3 or 40+ μg/m3 categories. The highest NO2 levels (20-30 µg/m3) were found by busy roads in the city centre:
- Meagher’s Quay
- Merchants Quay
- Summer Hill
The results of Clean Air Together Waterford are an indication of the level of NO2 measured at particular locations in Waterford City and environs in October 2025. NO2 levels can vary considerably over the year with changing traffic volumes and weather conditions. The EPA continually monitors air quality across Ireland and provides the Air Quality Index for Health and real-time results online at www.airquality.ie. Results are updated hourly, and people can check at any time whether the current air quality is good, fair, poor or very poor.
The Clean Air Together campaign in Waterford City and environs follows similar and successful campaigns in Dublin (2021), Cork City (2022), Galway City (2023) and Limerick City (2024). This is the fifth and final Clean Air Together campaign.
Air Quality Monitoring
The EPA continually monitors air quality across Ireland and provides the Air Quality Index for Health and real-time results online at www.airquality.ie. Results are updated hourly, and people can check at any time whether the current air quality is good, fair, poor or very poor.
Air quality is assessed through the National Ambient Air Quality Monitoring Programme which is comprised of 115 air monitoring stations, two of which are in Waterford City. Monitoring data from these stations is available in real time on www.airquality.ie and the data is used to inform national policy and meet Ireland’s commitments for European reporting.
The results of Clean Air Together Waterford are an indication of the level of NO2 measured at particular locations in Waterford City and environs in October 2025. NO2 levels can vary considerably over the year with changing traffic volumes and weather conditions. Therefore, the results should be viewed as a snapshot, representative of the NO2 levels in October 2025 and not an annual average of NO2.
What is Nitrogen Dioxide?
Nitrogen dioxide (NO2) is a gas emitted by traffic and is the main pollutant of concern from traffic pollution. NO2 can have negative impacts on respiratory and cardiovascular health. NO2 irritates the airways of the lungs and can increase symptoms of those suffering from lung diseases.
The results of Clean Air Together Waterford City represent a one-month indicative snapshot of NO2 levels in Waterford City and environs and are not directly comparable to the annual average EU limit for NO2 but do indicate locations where additional focus may be needed. It is the EPA’s view that Ireland and Europe should move towards achieving the health-based WHO air quality guidelines over time which are stricter than the current air quality standards for Europe. Comprehensive information on NO2, air quality and the air quality standards for Ireland is available at www.airquality.ie
How was Nitrogen Dioxide measured in the Clean Air Together project? [See demonstration video here: Clean Air Together – Tube Installation and Sharing Your Data (youtube.com)]
Nitrogen dioxide is measured using a measurement tube called a diffusion tube, which is a small plastic tube about the size of a lip stick tube. The bottom white cap of the tube is removed to let air pass through during the measurement period. A special substance is contained in the upper grey cap that can absorb NO2. The small tube is placed on the outside of window of the participant’s property and left in place for approximately a four-week period. Once the measurement period is over, air sampling is stopped by closing off the tube with the white cap and the tube is then returned by post for lab analysis.
Waterford City and County Council – Action for a healthier city
Waterford City and County Council will use the findings from the Clean Air Together campaign to strengthen and refine local air quality data collection, ensuring that future monitoring is more targeted, accurate, and reflective of real community experiences. By combining the EPA’s modelling expertise with detailed local insights gathered by residents, the Council will enhance its understanding of traffic-related pollution patterns across the city.
The campaign results provide useful insights into traffic-related air pollution across the city which can help support evidence-based decision-making in areas such as transport planning, active travel infrastructure, traffic management, and sustainable urban development.
The Council will also use the campaign insights to support behaviour change initiatives by working with residents, schools, businesses, and community groups to raise awareness of air quality issues and promote practical actions that reduce emissions. Through continued collaboration and community engagement, Waterford aims to deliver meaningful, long-term improvements in local air quality and public health.