CORINE Landcover 2024
The Environmental Protection Agency (EPA) has produced the latest CORINE (Co-ORdinated INformation on the Environment) landcover data series (CLC) for Ireland for the reference year 2024. This is the sixth instalment of CLC since the first data was produced for refence year 1990 and the EPA has been responsible for delivering the CLC dataset in Ireland since CORINE 2000.
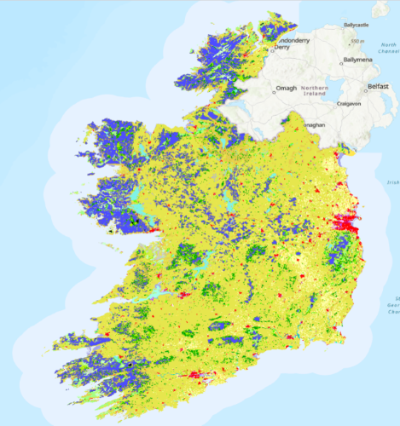
The CORINE 2024 project for Ireland includes the following three datasets as its deliverables:
- A revised 25ha CORINE 2018 dataset (CLC 2018_revised)
- The 2018 - 2024 5ha Change dataset (CLCCh 2018-2024)
- The Updated CLC 2024 25 ha dataset (CLC 2024)
All three datasets are now available to view and download from the EPA’s Geoportal at https://gis.epa.ie
The CORINE timeseries is part of the Copernicus Land Monitoring Service (CLMS). Corine and other pan European land monitoring data can also be accessed at https://land.copernicus.eu/en
The CORINE data for Ireland was produced with funding from the European Commission. Data for the project was provided by Copernicus, Coillte and the Department of Agriculture, Food and the Marine (DAFM).
The CORINE Landcover (CLC) nomenclature guidelines, including class definitions, can be found at Home :: Corine Land Cover classes
CORINE 2024 - Results
The full national statistics from the CORINE 2024 25ha landcover status dataset for Ireland at Level 1 are given below in table 1 and at level 3 in table 2.
The data shows that agriculture continues to be the dominant landcover type present in Ireland, covering 4.7 million hectares or 67.13% of the country. This is a slight reduction from 67.33% in CORINE 2018, followed by Wetlands at 14.7%, forest and semi-natural areas at 13.54%, Artificial at 2.51% and Water which covers 2.1%*.
Fig. 1 below shows the percentage cover of the five level 1 landcover classes in Ireland.
* Not including class 523 Sea and Ocean.
| 2024 |
2018 |
Difference | ||||
|---|---|---|---|---|---|---|
| Level 1 Class | Area (Ha) | % | Area (Ha) | % | Area (Ha) | % |
| ARTIFICIAL SURFACES | 178,406.80 | 2.52% | 172836.25 | 2.44% | 5570.55 | 0.08% |
| AGRICULTURE | 4,750,370.11 | 67.13% | 4,762,271.78 | 67.33% | -11,901.67 | -0.20% |
| FORESTRY & SEMI NATURAL AREAS | 958,798.96 | 13.55% | 951,696.31 | 13.46% | 7,102.66 | 0.09% |
| WETLANDS | 1,040,342.94 | 14.70% | 1,037,395.62 | 14.67% | 2,947.32 | 0.03% |
| WATER | 148,400.05 | 2.10% | 148,341.00 | 2.10% | 59.05 | 0.00% |
CORINE 2024 - Level 3 results
Looking at the individual level 3 classes, class 231 Pastures is the most dominant landcover type at 3,864,853.20 ha (54.62%); followed by class 412 Peatlands at 96,993.98 hectares (13.58%); and class 243 Land principally occupied by agriculture, with significant areas of natural vegetation at 488,186.53 ha (6.9%). The hierarchy of landcover classes at Level 3 is shown in fig. 2 below for the top ten classes. The full data is given in table 2.
-
Table 2. CORINE 2024 Level 3 Data
Code Description Area (ha) Count Percentage 111 Continuous urban fabric 3,887 36 0.05% 112 Discontinuous urban fabric 111,920 746 1.58% 121 Industrial and commercial units 16,170 213 0.23% 122 Road and rail network 7,612 57 0.11% 123 Sea ports 945 17 0.01% 124 Airports 2,465 12 0.03% 131 Mineral extraction sites 9,209 177 0.13% 132 Dump 1,195 20 0.02% 133 Construction sites 991 23 0.01% 141 Green urban areas 3,262 50 0.05% 142 Sport and leisure facilities 20,751 315 0.29% 211 Non-irrigated arable land 337,036 2,349 4.76% 222 Fruit trees and berry plantations 295 6 0.00% 231 Pastures 3,864,853 1,102 54.62% 242 Complex cultivation patterns 59,999 524 0.85% 243 Agriculture with significant areas of natural vegetation 488,187 2,005 6.90% 311 Broad-leaved forests 49,727 822 0.70% 312 Coniferous forests 364,593 3,314 5.15% 313 Mixed forests 78,644 1,081 1.11% 321 Natural grassland 48,302 216 0.68% 322 Moors and heathlands 139,488 372 1.97% 324 Transitional woodland scrub 186,222 2,214 2.63% 331 Beaches, dunes, sand 11275.52391 113 0.16% 332 Bare rocks 19643.97143 54 0.28% 333 Sparsely vegetated areas 57584.19199 217 0.81% 334 Burnt areas 3320.267837 15 0.05% 411 Inland marshes 24309.56998 282 0.34% 412 Peat bogs 960993.9781 1890 13.58% 421 Salt marshes 5425.224609 68 0.08% 423 Intertidal flats 49614.16764 206 0.70% 511 Stream courses 7150.867712 29 0.10% 512 Water bodies 112233.5818 507 1.59% 521 Coastal lagoons 1911.203809 14 0.03% 522 Estuaries 27104.39987 54 0.38% 523 Sea and ocean 4053818.802 1 Open in Excel: CLC2024_L3_statistics.xlsx (XLS 12KB)
Open in CSV : CLC2024_table_T4.csv (CSV 1KB)
CLC Change 2018 -2024
The 2018 - 2024 5ha Change dataset (CLCCh 2018-2024), maps all landcover change in Ireland greater than 5 hectares between the reference years 2018 and 2024. Looking at this data gives greater detail on landcover dynamics in Ireland than from just looking at the 25ha status layers alone. The full change statistics are available to view and download from table 3 below. The dominant change types are also illustrated in fig. 3 below.
Key Landcover changes 2018 - 2024
-
Table 3. CORINE change 2018 -2024 Data table
change code_2018 code_2024 FREQUENCY Area_ha Area_sqm % 231-211 231 211 5,472 77,218.10 772,181,002.84 28.19% 324-312 324 312 3,832 72,058.60 720,585,982.14 26.31% 312-324 312 324 2,901 49,860.75 498,607,536.09 18.20% 211-231 211 231 3,368 40,073.41 400,734,100.56 14.63% 231-324 231 324 1,672 16,872.86 168,728,639.63 6.16% 243-324 243 324 109 1,267.95 12,679,504.40 0.46% 211-211 211 211 76 1,149.01 11,490,104.66 0.42% 231-133 231 133 99 1,146.14 11,461,395.57 0.42% 334-412 334 412 10 1,043.32 10,433,182.46 0.38% 231-112 231 112 76 956.34 9,563,366.66 0.35% 324-311 324 311 85 923.68 9,236,821.14 0.34% 133-112 133 112 59 822.70 8,226,952.41 0.30% 211-133 211 133 45 786.89 7,868,949.60 0.29% 412-324 412 324 59 710.04 7,100,399.75 0.26% 211-121 211 121 32 701.88 7,018,775.10 0.26% 324-313 324 313 51 662.84 6,628,430.48 0.24% 231-121 231 121 48 646.64 6,466,382.45 0.24% 322-334 322 334 3 622.08 6,220,773.35 0.23% 313-324 313 324 50 573.93 5,739,314.30 0.21% 211-324 211 324 42 512.99 5,129,861.18 0.19% 324-324 324 324 30 484.74 4,847,356.82 0.18% 311-324 311 324 44 434.53 4,345,317.93 0.16% 133-122 133 122 6 425.21 4,252,053.90 0.16% 312-312 312 312 15 424.61 4,246,137.01 0.16% 231-122 231 122 11 337.29 3,372,931.12 0.12% 322-324 322 324 14 210.49 2,104,943.45 0.08% 231-311 231 311 21 186.58 1,865,844.80 0.07% 231-131 231 131 24 184.29 1,842,892.03 0.07% 211-112 211 112 16 163.18 1,631,804.11 0.06% 412-131 412 131 4 146.28 1,462,788.03 0.05% 334-332 334 332 1 115.86 1,158,604.21 0.04% 211-131 211 131 9 110.46 1,104,618.73 0.04% 133-124 133 124 1 106.64 1,066,377.89 0.04% 334-333 334 333 1 106.36 1,063,583.26 0.04% 334-322 334 322 3 104.83 1,048,311.74 0.04% 242-133 242 133 7 91.59 915,894.37 0.03% 311-231 311 231 13 81.36 813,625.36 0.03% 242-211 242 211 8 80.54 805,352.76 0.03% 312-231 312 231 11 78.77 787,738.60 0.03% 131-132 131 132 1 75.78 757,763.26 0.03% 133-123 133 123 2 70.32 703,164.70 0.03% 243-131 243 131 3 67.66 676,550.84 0.02% 142-324 142 324 2 63.18 631,770.15 0.02% 131-131 131 131 3 58.87 588,704.10 0.02% 321-324 321 324 4 57.72 577,213.59 0.02% 121-121 121 121 4 54.72 547,170.86 0.02% 243-211 243 211 5 54.45 544,454.39 0.02% 243-122 243 122 4 53.61 536,145.96 0.02% 231-313 231 313 4 44.01 440,131.59 0.02% 312-212 312 212 2 42.72 427,203.46 0.02% 141-133 141 133 2 39.09 390,895.00 0.01% 142-211 142 211 1 39.08 390,809.01 0.01% 133-121 133 121 5 38.27 382,732.62 0.01% 243-112 243 112 4 35.39 353,917.04 0.01% 324-133 324 133 5 35.09 350,854.71 0.01% 243-231 243 231 2 33.77 337,677.89 0.01% 142-133 142 133 3 33.10 330,994.39 0.01% 311-211 311 211 3 32.36 323,618.03 0.01% 242-212 242 212 1 31.83 318,273.82 0.01% 231-132 231 132 2 31.08 310,841.87 0.01% 333-334 333 334 1 27.26 272,577.84 0.01% 141-112 141 112 4 26.22 262,175.38 0.01% 142-231 142 231 1 25.10 251,003.93 0.01% 133-211 133 211 1 24.46 244,580.59 0.01% 231-231 231 231 2 22.21 222,052.12 0.01% 133-133 133 133 1 20.62 206,246.89 0.01% 412-231 412 231 3 19.60 195,957.23 0.01% 312-131 312 131 1 19.46 194,583.36 0.01% 231-142 231 142 3 19.42 194,245.66 0.01% 242-231 242 231 1 19.07 190,736.35 0.01% 243-133 243 133 3 17.67 176,658.28 0.01% 243-121 243 121 1 17.01 170,106.01 0.01% 411-324 411 324 2 15.75 157,544.61 0.01% 112-112 112 112 2 14.90 148,997.99 0.01% 211-123 211 123 1 14.49 144,871.27 0.01% 142-222 142 222 1 13.48 134,842.73 0.00% 313-131 313 131 1 10.54 105,368.87 0.00% 412-243 412 243 1 10.37 103,705.72 0.00% 133-141 133 141 1 9.90 99,037.11 0.00% 312-133 312 133 1 9.33 93,304.35 0.00% 242-121 242 121 1 8.16 81,591.40 0.00% 313-313 313 313 1 7.86 78,598.24 0.00% 243-313 243 313 1 7.25 72,459.89 0.00% 131-231 131 231 1 6.82 68,205.63 0.00% 312-121 312 121 1 6.65 66,520.35 0.00% 333-324 333 324 1 6.41 64,088.44 0.00% 243-311 243 311 1 5.96 59,625.23 0.00% 133-231 133 231 1 5.93 59,288.58 0.00% 311-121 311 121 1 5.85 58,519.40 0.00% 311-312 311 312 1 5.54 55,444.76 0.00% 411-133 411 133 1 5.35 53,463.38 0.00% 142-121 142 121 1 5.22 52,240.71 0.00% 523-123 523 123 1 5.06 50,570.32 0.00% 242-142 242 142 1 5.05 50,480.33 0.00% 242-131 242 131 1 4.55 45,482.25 0.00% 324-131 324 131 1 3.47 34,729.91 0.00% 511-122 511 122 1 3.06 30,642.77 0.00% 313-211 313 211 1 1.26 12,619.87 0.00% 112-133 112 133 1 1.25 12,535.32 0.00% Total change 18,441 273,933.42 2,739,334,241.23 Open in Excel: CLC2024_L3_statistics.xlsx (XLS 12KB)
Open in CSV : CLCCh1824_table_T4.csv (CSV 4KB)
Key landcover change trends 2018 - 2024
- Overall there was 273,933 ha of change in Ireland between 2018 and 2024. This represents 3.87% of the total national area (ROI). This is an increase of 26,622 ha or 0.37% of the national area compared with the previous CORINE reporting period of 2012 -2018.
- Change and rotation within the agriculture and forestry classes remains the dominant landcover change type, accounting for 96% of all change by area.
- The largest individual change type was the conversion of 77,218 ha of land from class 231 Pasture to 211 Arable land, representing 28% of all change. This is an increase of 23,107 ha or 42% in this change type compared to the previous reporting period (2012-2018).
- There has been a corresponding decrease in the amount of 211 Arable converted to 231 Pasture in the same period. This type of change has fallen from 58,248 ha in 202-2018 to 40,073ha in 2018-2024, a drop of 18% in the rate of this change type.
- 4,389 ha of land was converted into forestry (afforestation), primarily from agricultural land. This is a 28% increase in afforestation since the last reporting period.
- There was a 40% increase in the rate of forestry maturing from transitional forestry (class 324) to the mature forestry classes (312, 313 or 311). There was also a 6.6% increase in the rate of clearfelling.
- There was a 127% (3,167 ha) increase in the rate of non-artificial land converted to an Artificial surface class. This is the largest increase in rate of change since 2018 at Level 1. 39% of this was in the development of new construction sites (class 133).
- 62 % new land converted to an artificial surface came from the 231 Pasture class (3,515 ha).
- For the first time, areas of land above 5ha which were converted to 'solar farms' were mapped in CORINE. In total, 751 ha (0.01% of national area) of land was converted to class 121 Industrial or commercial units which incorporates solar farms or parks. This includes 407 ha of class 211 arable land and 344 ha of class 231 Pastures.
- 37 instances of new solar farms in total were identified. The largest of which was 151 ha of agricultural land in Co. Cork, see image below.
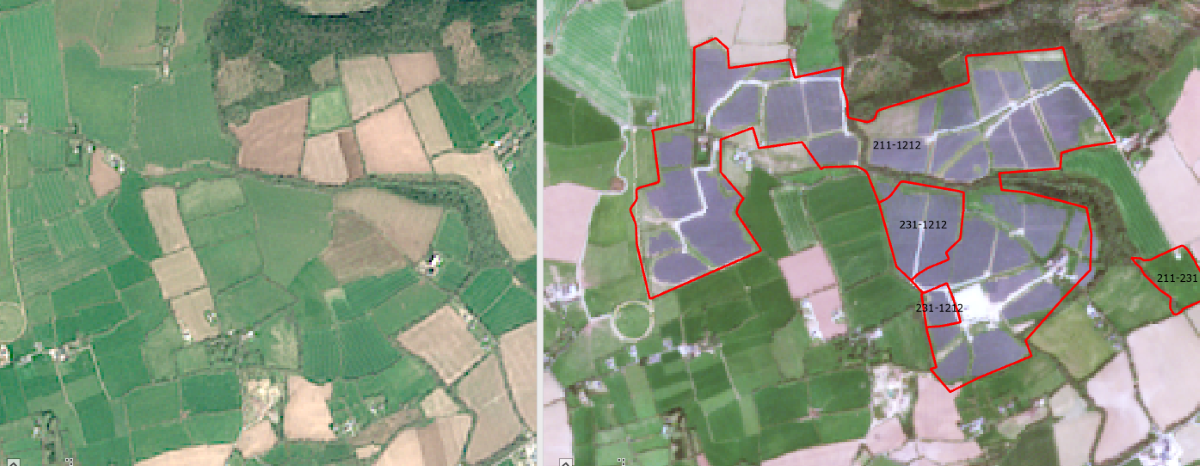
Fig. 4 Sentinel 2 Earth Observation Imagery showing an example of agricultural land (Class 211 and class 231) converted to class 1212 (Solar Parks) between 2018 (left image) and 2024 (right image).
View the data on the EPA Map Viewer https://gis.epa.ie/EPAMaps/
Download the data from the EPA GeoPortal https://gis.epa.ie/GetData/Download