FAQs on air quality
-
Why is air quality important?
Air pollution is a major environmental risk to health. According to the World Health Organisation (WHO), air pollution can increase the risk of stroke, heart disease, lung cancer, and both chronic and acute respiratory diseases, including asthma. The World Health Organisation estimates that more than 400,000 premature deaths are attributable to poor air quality in Europe annually. In Ireland, the number of premature deaths attributable to air pollution is estimated at 1,300 people (Air Quality in Europe 2020, EEA) and is mainly due to cardiovascular disease. The WHO has described air pollution as the ‘single biggest environmental health risk’.
-
What are the main pollutants of concern to the environment and human health?
The ambient air quality pollutants of most concern on an EU-wide level are Nitrogen Dioxide (NO2), Particulate Matter (PM), Ozone (O3) and Polycyclic Aromatic Hydrocarbons (PAHs). They can impact on human health, ecosystems and vegetation and monitoring is carried out to determine their concentration levels.
-
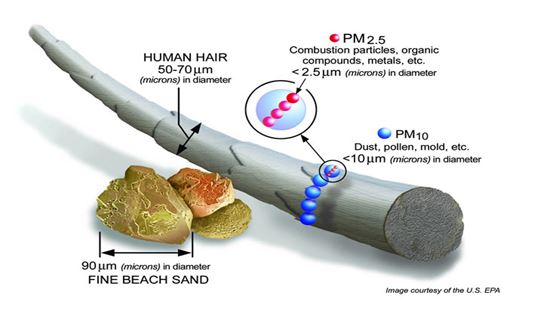
What is Particulate Matter and how does it get into the atmosphere?
PM are a complex mixture of solid and liquid particles of organic and inorganic substances suspended in the air. typically measured as PM10 and PM2.5 with diameters of 10μm (microns) or 2.5μm. PM is a common proxy indicator for air pollution.
It affects more people than any other pollutant. While particles with a diameter of 10 microns or less, (≤ PM10) can penetrate and lodge deep inside the lungs, the even more health-damaging particles are those with a diameter of 2.5 microns or less, (≤ PM2.5). PM2.5 can penetrate the lung barrier and enter the blood system. Chronic exposure to particles contributes to the risk of developing cardiovascular and respiratory diseases, as well as of lung cancer.
The major components of PM are sulfate, nitrates, ammonia, sodium chloride, black carbon, mineral dust and water. These particles can consist of direct emissions such as dust, emissions from combustion engines, from the burning of solid fuels or natural sources such as windblown salt, plant spores and pollens. These direct emissions are known as primary PM.
PM can also be produced indirectly by formation of aerosols through reactions of other pollutants such as Nitrogen Oxides (NOX) and Sulphur Dioxide (SO2); these are known as secondary PM. In Ireland, the main sources are solid fuel burning and vehicular traffic.
Air quality measurements are typically reported in terms of daily or annual mean concentrations of PM10 particles per cubic meter of air volume (m3). Routine air quality measurements typically describe such PM concentrations in terms of micrograms per cubic meter (μg/m3). Concentrations of fine particles (PM2.5 or smaller), are also reported.
-
What is Nitrogen Dioxide and Nitrogen Oxides?
Emissions from traffic are the main source of Nitrogen Oxides in Ireland, along with electricity generating stations and industry. Nitrogen Dioxide can affect the throat and lung. The main effects are emphysema and cellular damage.
It impacts visually as it has a brown colour and gives rise to a brown haze. Oxides of Nitrogen contribute to the formation of acid rain and ozone.
Levels in Ireland are moderate but are increasing due to growth in traffic numbers.
-
What is Carbon Monoxide?
The main source of Carbon Monoxide in Ireland is traffic. It is absorbed into the bloodstream more readily than oxygen, so the relatively small quantities in inhaled air can have harmful effects.
Prolonged exposure can cause tissue damage and individuals suffering from cardiovascular disease are particularly at risk. Levels in Ireland are low.
-
What is Sulphur Dioxide?
The main source of Sulphur Dioxide in Ireland is burning coal and oil to heat homes and industries and to produce electricity.
It is an irritant gas which attacks the throat and lungs. Prolonged exposure can lead to increases in respiratory illnesses like chronic bronchitis. It contributes to the formation of acid rain, which damages vegetation and buildings.
Levels in Ireland are low to moderate. Overall levels have decreased over recent years due to increased use of low-sulphur "smokeless" coal, increased use of natural gas instead of solid fuels and reduced industrial emissions through IPC licensing.
-
What is Ozone?
Ozone is a gas composed of three atoms of oxygen (O3). It is a natural component of the atmosphere. Most Ozone is found high up in the stratosphere, the layer of the atmosphere between 12km and 50km above sea level. Stratospheric ozone is essential to life on earth as it protects us from harmful rays from the sun.
Ozone is also found in the troposphere, the layer of the atmosphere next to the earth. This ground-level Ozone is not emitted directly into the atmosphere and is a secondary pollutant produced by reaction between Nitrogen Dioxide, Hydrocarbons and sunlight. Ozone can be described as good, if found high in the atmosphere, or bad, when found at ground level.
The formation of ground level ozone (O3) is complex. It is formed from reactions between pollutants such as NOX, carbon monoxide and various volatile organic compounds (VOCs) in the presence of sunlight. Ozone is also a transboundary pollutant - it originates in one country but is able to cause damage in another country's environment, by crossing borders. Its impacts mainly affect central and southern Europe during the summer months. Ozone levels over Ireland can be influenced by the transport of pollutants from other European regions and across the Atlantic from North America. High concentrations of ground level ozone can affect the functioning of the respiratory system and damage crops and other vegetation. Exposure to high concentrations of tropospheric ozone causes chest pains, nausea and coughing in humans.
Long term exposure to moderate concentrations causes a reduction in lung capacity and can worsen heart disease, bronchitis, emphysema and asthma. Tropospheric ozone contributes to the greenhouse effect and subsequent global climate change.
Levels of Ozone in Ireland are moderate.
Ozone can be “good” or “bad” for health and the environment depending on where it’s found in the atmosphere. Stratospheric ozone is “good” because it protects living things from ultraviolet radiation from the sun. Ground-level ozone is “bad” because it can trigger a variety of health problems, particularly for children, the elderly, and people of all ages who have lung diseases such as asthma. Learn more about ground-level ozone.
Ozone levels are higher in Summer than Winter: Ozone formation follows patterns. During the day, ozone formation occurs. However, during the night, when solar radiation and temperatures are low ozone is destroyed. Similar sequences of reactions occur on an annual basis, with ozone levels lower in winter (more destroyed) and highest in summer (more formed). As a result ozone concentrations tend to be higher in June, July and August in the northern hemisphere.
Ozone levels are higher in Rural areas than Urban: In urban areas, where nitrous oxides and VOCs reach high levels (due to greater volumes of traffic and greater levels of fossil-fuel combustion) ozone levels are low in comparison to rural sites. The nitrous oxides are oxidised by ozone gas, which causes a reduction in ozone levels - more ozone is destroyed by forming different pollutants such as NO2. Rural areas, which have a lot less traffic and industrial activity, tend to have higher concentrations of ozone (i.e., less nitrous oxides are present to deplete the ozone concentrations).
NO2 + O2 (+ solar UV-light, + heat) --> NO + O3
In summary: nitrogen dioxide and oxygen react, which results in nitrogen monoxide and ozone. This reaction is speeded up in warmer conditions and with more UV-light.
This is an equilibrium reaction, which means the reaction also works in the other direction (whereby ozone gets degraded again): NO + O3 --> NO2 + O2.
-
How does ground-level ozone form?
Tropospheric, or ground level ozone, is not emitted directly into the air, but is created by chemical reactions between oxides of nitrogen (NOx) and volatile organic compounds (VOC). This happens when pollutants emitted by cars, power plants, industrial boilers, refineries, chemical plants, and other sources chemically react in the presence of sunlight.
Sunshine and heat help ozone to form, so ozone pollution is most likely to be a problem on warm, sunny days.
Another unusual thing about ozone is that it reacts with nitric oxide (NO) which is usually found in towns and cities near roads. As a result, ozone pollution is more of a problem in the countryside than in our cities.
-
What are Polycyclic Aromatic Hydrocarbons?
This encompasses a wide range of compounds that consist of two or more aromatic rings made entirely of Carbon and Hydrogen. Airborne PAHs, when inhaled, are believed to produce lung cancer.
Sources in Ireland are car emissions and the burning of fossil fuels, such as coal and turf.
Benzo(a)pyrene (BaP) is the most common PAH in ambient air and is therefore used as a marker to set air quality and emission standards.
-
What are the primary sources of air pollution in Ireland?
Particulate Matter from solid fuel burning remains the greatest threat to good air quality in Ireland. This is closely followed by Nitrogen Dioxide from transport emissions.
Health effects of air pollution
-
How Does Air Pollution Affect Us?
Most healthy people do not feel any different if the air quality is worse than usual for a short time. However, some people do find that air pollution affects their health and wellbeing.
When air pollution is higher than usual, people who already have heart or lung problems are more likely to become unwell and need treatment. They should take their doctor’s advice.
Older people are more likely to suffer from heart and lung problems than young people, so it makes good sense for them to be aware of the air quality.
Children (as long as they are well) usually need not stay away from school, or avoid taking part in games, because of air pollution. Children with asthma should make sure they have their usual medicines with them on days when levels of air pollution are higher than usual.
If air pollution reaches “very high” levels, even some healthy people may get a sore or dry throat, sore eyes or perhaps a tickly cough.
However, different people are affected in different ways. Some people are very sensitive to air pollution and find that even low levels of pollution affect their wellbeing. So, anyone who has asthma or any other health problem that may make them sensitive to pollution should take the advice of their doctor.
-
What do health studies show?
Most people think of respiratory illnesses as the effect on our health of air pollution. However, scientific studies have linked air pollution to a range of health outcomes, which vary according to the key stages of development of the human life-cycle.
For example, in the womb air pollution is linked with lower birth weights of babies. In toddlers, development problems are increased due to air pollution with increased rates of wheezing and coughing. Slower development lung function is observed in children, alongside asthma and the onset of Atherosclerosis (a hardening of the artery walls), whilst in adults a wide range of symptoms including heart attacks, the acceleration of lung function decline, Type 2 diabetes, asthma and lung cancers are now all linked to air pollution. For the elderly, exposure to poor air quality increases the probability of poor cognition, strokes and heart failure.
-
Should I worry about air pollution for my health?
Numerous research studies, replicated across the world agree that breathing air of poor quality impacts on people’s health.
Exposure to poor air quality is associated with both ill health and premature death. People may be affected by poor air quality even if they never experience any noticeable pollution related health effects such as breathing problems.
Air pollution can cause short term (nearly immediate) symptoms and long term (chronic disease) effects.
-
What are the short term effects?
Short term health effects occur when weather conditions cause pollutant levels to build up above normal background conditions. On days when air quality deteriorates more people are admitted to hospital for lung and heart problems while increased numbers of people visit their GP and need to take more medicine. Many people will not notice any ill effects, but those who are sensitive may feel a difference in their symptoms and well being. Those with existing breathing problems such as asthma or COPD can be severely affected.
-
What are the long term effects?
It is now believed that the long term health effects of air pollution are larger than the short term or acute effects. These effects happen at lower pollution levels than the short term effects and are often not noticed by people at the time the damage is being done.
Until the 1990s, longer term health studies focused mainly on respiratory health, since the lungs are the primary gateway for pollution to enter the human body. As further findings were made, researchers began to recognise that air pollution also affects the heart, meaning many more people are affected. This means that poor air quality is a much bigger public health challenge than previously thought.
More recently studies are investigating the possible link between poor air quality and outcomes such as low birth weight infants and neurological health. -
What are the health implications of PM10 and PM2.5?
Epidemiological studies show that the most severe health effects caused by air pollution are due to particulate matter, and to a lesser extent, to ozone. Inhalation of particulate matter causes irritation or damage to the pulmonary tissue. Particulate matter can cause both short and long-term health effects.
According to the World Health Organisation (WHO) there is no safe threshold value below which no harmful effects occur. While particles with a diameter of 10 microns or less, (≤ PM10) can penetrate and lodge deep inside the lungs, the even more health-damaging particles are those with a diameter of 2.5 microns or less, (≤ PM2.5). PM2.5 can penetrate the lung barrier and enter the blood system. Chronic exposure to particles contributes to the risk of developing cardiovascular and respiratory diseases, as well as of lung cancer.
More information can be found at
https://www.who.int/news-room/fact-sheets/detail/ambient-(outdoor)-air-quality-and-health
Air pollution in Ireland
-
What actions are being taken to improve air quality in Ireland?
The Department of the Environment, Climate Action and Communications (DECC) are currently developing a National Clean Air Strategy with the aim of promoting policies to enhance and protect the quality of the air we breathe.
-
What is the best way to find out what the current air quality conditions are in my area?
There are several options to get information on air quality in Ireland.
- You can see a list of air monitoring stations through the following link: https://www.airquality.ie/stations
- The Air Quality Index for Health (AQIH) for each station is updated hourly. You can access the data at the following link: https://www.airquality.ie
- You can view predicted daily AQIH, particulate matter, nitrogen dioxide and ozone from the Air Quality Forecast at: https://www.airquality.ie
- The EPA regularly provides updates on air quality at the following link: https://twitter.com/EPAAirQuality.
-
How does the air quality map work?
The air-quality map colour-codes the readings from the air quality monitoring stations in Ireland. The map can be viewed at: https://www.airquality.ie
The readings are based on the current air quality index (1 to 10) as it relates to health. This is called the Air Quality Index for Health (AQIH) status. The monitoring stations map updates at least once an hour.
The air quality readings are colour-coded from 1 being good (light green) to 10 being very poor (purple).Green is good
Typically, most air quality monitoring stations are green. This shows the quality of the air is good.
Blue means no automatic update available in this area
If a station is blue, it means that it does not update data automatically. Instead, the air quality reading must first be analysed in a laboratory before we can report on air quality.
Grey means information not available at this time
If a station is displayed in grey on the map there may be:
- an instrument or communication issue at the monitoring station, or
- planned maintenance or upgrade taking place.
You can see all EPA air quality reports and the latest air quality bulletin in our Reports and Bulletins.
Access a list of all the monitoring stations.
This map also presents the twice daily updated Air Quality Forecast maps. These show the expected air quality for:
- today,
- tomorrow, and
- the day after tomorrow.
-
How are monitoring stations chosen?
Firstly we assess population exposure – the areas of the country that are more densely populated need to be monitored more – To help with this the country in broken down into zones - Zone A (Dublin), Zone B (Cork) , Zone C (large Towns) and Zone D (rural Ireland) – see FAQ “what are AQ Zones?”
The selection is also influenced by Geographical spread of monitoring.
Then comes the Macroscale requirements – what type of station is needed – traffic or background?
The location of the station is influenced mostly by being ‘representative of the exposure of the population to air pollution’ considerations in this regard include but are not limited to –
- Proximity to sources
- Predominant wind direction in the area.
- Topography of the locality
- Avoidance of measurement of micro-environments
- Knowledge and experience of site assessment team
Then comes the Microscale requirements, Health and Safety issues, access to power, security issues, access etc
All monitoring stations within the National Ambient Air Quality Monitoring Network, satisfy both the macroscale and microscale siting criteria set out in Annexes III and VIII of the CAFÉ Directive.
-
What is the Local Monitoring Network?
The Local Monitoring Network measures near real-time indicative results for particulate matter. The network is being setup as part of the National Ambient Air Monitoring Programme (AAMP) 2017 - 2022.
Currently the Local Monitoring Network for particulate matter 2.5 microns (PM2.5) and 10 microns (PM10) are assessed at locations highlighted on the AQIH map as angular map pins. Click on a map pin to access the latest available data. Monitors undergoing calibration/maintenance will have their map pins coloured grey. Data will be restored once monitors have been re-installed.
-
What is The National Ambient Air Quality Monitoring Programme (AAMP)?
The 5‐year National Ambient Air Monitoring Programme was launched in November 2017. The main aims of AAMP are:
- To greatly expanded national monitoring network with 38 new automatic monitoring stations, providing enhanced real-time information to the public.
- Modelling and forecasting capability, to provide an ongoing air quality forecast to the public.
- Encouraging greater understanding and involvement of the public in air quality issues utilising citizen engagement and citizen science initiatives.
-
Is there any air monitoring taking place at or near schools?
The EPA in partnership with An Taisce run a schools project, called the Globe Programme. Its focus is on the measurement of Nitrogen Dioxide concentrations in the air resulting from car use. Find out more information on the Globe Programme.
-
Is historical air quality data accessible to the public?
Yes. All historical air quality data is available to download from our SAFER database https://eparesearch.epa.ie/safer/
View list of current air monitoring stations
View details on historic air monitoring sites
-
How do I monitor air quality in my home?
The EPA only monitors outdoor ambient air. Private consultancy firms can provide air quality monitoring in homes.
If you are concerned about indoor air quality in your workplace you should contact the Health and Safety Authority. Tel: 1890 289 389 or visit the HSA website.
Air Quality Indices and Standards
-
What are the Air Quality legislation and guidance?
The World Health Organisation publishes Air Quality Guidelines based on certain pollutants health effects and are there to aid policy makers. The European Union developed their Ambient Air Quality (AAQ) Directives (Directives 2008/50/EC and 2004/107/EC) considering the WHO Guideline figures and the situation in Europe at the time. For some pollutants, they mirror each other exactly (NO2 & CO) whereas for others the WHO guidelines are tighter than EU regulation (SO2, O3 and PM)
Pollutant Air Quality Guidelines (WHO, 2005) EU Standards (Directive 2008/50/EC) no. of EU exceedances allowed in a year PM2.5 10 µg /m3 annual mean
25 µg /m3 annual mean
-
25 µg /m3 24-hour mean
-
-
PM10 20 µg /m3 annual mean
40 µg /m3 annual mean
-
50 µg /m3 24-hour mean
50 µg /m3 24-hour mean
35
O3 100 µg /m3 8-hour mean 120 µg /m3 8-hour mean 25 averaged over 3 years NO2 40 µg /m3 annual mean
40 µg /m3 annual mean
-
200 µg /m3 1-hour mean
200 µg /m3 1-hour mean
18
SO2 20 µg /m3 24-hour mean
125 µg /m3 24-hour mean
3
-------------
350 µg /m3 1-hour mean
24
500 µg /m3 10-minute mean
-----------
-
CO 10,000 µg /m3 8-hour mean 10,000 µg /m3 8-hour mean - -
What are the World Health Organisation’s air quality guidelines-AQG’s?
Air quality guidelines (AQG’s) were published by the World Health Organisation in 1987 and revised in 1997. The current ones are based on revised 2005 guidelines of selected pollutants due to scientific evidence of the health effects and are applicable globally. The WHO AQG’s are designed to offer guidance to countries trying to reduce the health impacts of air pollution, and to help policy-makers set targets and standards for air quality in different parts of the world – they indicate the levels of pollution at which risk to health is minimal, no level of air pollution is safe.
The update selected ozone (reduced from 120 to 100μg/m3), nitrogen dioxide, sulphur dioxide (reduced from 125 to 20μg/m3) and significantly reduced PM standards (from 70 to 20 μg/m3), which WHO felt could reduce deaths in polluted cities by as much as 15% a year (WHO, 2016).
-
Is Ireland compliant with EU legislative limit values?
No. There was an exceedance of the NO2 EU annual limit value at one monitoring station in Dublin in 2019. The Local Authorities in Dublin must produce an air quality plan to deal with this exceedance.
-
What about World Health Organization (WHO) air quality guideline values?
The tighter World Health Organization (WHO) air quality guideline values were exceeded at a number of monitoring sites for particulate matter (PM10 and PM2.5), ozone and NO2.
-
What are the EU Air Quality (AAQ) Directives?
European Union legislation sets air quality standards both for the short-term (hourly/daily) and long-term (annual) air quality levels: standards for long-term levels are necessarily stricter than for short-term levels, because serious health effects may occur from long-term exposure to such pollutants. Under EU law a limit value is legally binding, for a target value the obligation is to take all necessary measures not entailing disproportionate costs to ensure that it is attained, and so it is less strict than a limit value.
Directive 2008/50/EC introduced additional PM2.5 objectives. These objectives are set at national level and are based on the average exposure indicator (AEI). This is determined as a 3-year running annual mean PM2.5 concentration averaged over the selected monitoring stations in agglomerations and larger urban areas, set in urban background locations to best assess the PM2.5 exposure of the general population.
The regulations on air quality in Ireland are based on European Union CAFE regulations (Ambient Air Quality and Cleaner Air for Europe Directive 2008/50/EC) published in May 2008 and the fourth Daughter Directive (2004/107/EC)- collectively referred to as the AAQD. These were transposed into Irish Law by the Air Quality Standards Regulations (S.I. 180 of 2011) and the Arsenic, Cadmium, Mercury, Nickel and Polycyclic Aromatic Hydrocarbons in Ambient Air Regulations (S.I. 58 of 2009). They rely on defined limits, over specified periods, for concentrations of certain pollutants. The ones relating to the AQIH are listed below:
Sulphur Dioxide:
WHO guidelines (2005) are significantly lower than the CAFE limits at 20μg/m3 per 24-hour mean instead of 120μg/m3. It was found that people with asthma can exhibit symptoms after ten minutes of exposure, so a 500μg/m3 10-minute mean was included. Much lower levels of SO2 than previously thought can cause harm.
Sources of SO2 include burning coal and oil. It is a colourless irritant gas that irritates the eyes, attacks throat and lungs. It aggravates asthma and chronic bronchitis. When levels are high the number of hospital admissions for cardiac disease and mortality increase. It contributes to acid rain. Levels are usually low to moderate in Ireland and have dropped due to “smokeless” coal (low sulphur), more use of natural gas and reduced emissions from industry through IPC licencing. The ban on the sale of smoky coal was first introduced in Dublin in 1990 before being extended to larger towns. This is due to be expanded to a nationwide ban for all of Ireland in Autumn 2019.
Nitrogen Dioxide:
WHO guidelines (2005) are the same as the CAFE limits at 40μg/m3annual mean & 200μg/m31-hour mean. The major sources of NO2 are combustion - car and ship engines, electricity generation and industry. It is a toxic gas that effects throat and lungs by inflaming the lining causing respiratory problems. It can cause emphysema, bronchitis and cellular damage. People with asthma, young children and older adults have an increased sensitivity to its effects. NO2 can combine with particles in the air to form a reddish-brown haze over cities, like the brown smog over Cape Town in winter or Los Angeles in early Autumn (Walton, 2005). Oxides of nitrogen (NOx) can contribute to the formation of acid rain, form an important fraction of PM2.5 and, in the presence of UV light, form low level ozone which causes breathing problems and can trigger asthma. In atmospheric chemistry, the term NOx denotes the total concentration of NO and NO2 which convert back and forth in the presence of sunlight. At the point of emission (i.e. the exhaust pipe), the proportion of NOx is around 90% NO and 10% NO2. After a few hours in the atmosphere and in the presence of volatile organic compounds (VOCs) the NO is converted to NO2. This reaction can occur over a couple of seconds to a few hours. NO2 reacts further with other substances in the air to form nitric acid, particulate matter and substances called PANs (peroxyacyl nitrates).
Also with sunlight NO2 can convert back to NO and produce ozone (O3) as a "secondary" pollutant. During daylight hours these concentrations, together with that of ozone, are in steady state, also known as photostationary state (PSS); the ratio of NO to NO2 is determined by the intensity of sunshine (which converts NO2 to NO) and the concentration of ozone (which reacts with NO to again form NO2). In areas where road vehicles are the main source of NOx there is often higher NO2 concentrations during peak traffic times such as around 9am and 5pm weekdays. Ozone (O3) concentration increases during the day while the NO2 concentration decreases. After 6pm, the NO2 concentration builds up as there is no sunlight to convert NO2 back to NO. There are also natural sources of NOx emissions such as wildfires and lightning strikes (9% in US) but most is caused by human activity.
There was an exceedance of the annual limit value for NO2 at the St Johns Road West monitoring station in Dublin, in 2019.
Particulate Matter:
Particulate matter (PM10 and PM2.5) is often used to represent air pollution as it affects everyone. There is a close, quantitative relationship between exposure to high concentrations of small particulates (PM10 and PM2.5) and increased mortality or morbidity, both daily and over time (WH Organisation, 2016). Conversely if PM levels are reduced in a city then mortality is also reduced.
PM is made up of sulphates, nitrates, ammonia, sodium chloride, black carbon, mineral dust and water suspended in the air. They are a main cause of pollution haze or smog. There are many sources of particulate matter (dust) including vehicle exhaust emissions, soil and road surfaces, construction works and industrial emissions. Particulate matter can be formed from reactions between different pollutant gases.
Small particles can penetrate the lungs and cause damage. These are known as PM10 (diameter less than 10µm). PM2.5 (diameter less than 2.5µm) can penetrate the lung barrier and enter the blood stream. PM1 and smaller may cross the brain barrier.
There are high levels of PM10 in many cities and towns. In smokeless fuel zones, set up in Ireland in the 1990’s, levels of particulate matter decreased after a ban on household burning of bituminous coal. WHO AQG values are set for coarse Particulate Matter (PM10) at 20μg/m3 annual mean and 50μg/m3 24-hour mean.
PM2.5 WHO AQG is 10 μg/m3
annual mean & 25μg/m3 24-hour mean,(CAFE limits are twice the WHO annual means)
but there is no safe threshold value for PM. In European cities where PM concentrations comply with guideline levels, it is estimated that average life expectancy is 8.6 months lower than it would otherwise be, due to PM exposures from human sources (WHO, 2018).
Carbon Monoxide:
The main source of carbon monoxide (CO) is traffic – incomplete combustion of carbon-based products. Carbon monoxide concentrations inside vehicles are generally higher than those measured in ambient outdoor air and higher levels can be encountered in car parks and tunnels. CO is absorbed faster than oxygen as the affinity of haemoglobin for CO is 200–250 times that for oxygen. This can cause tissue damage and heart attacks. The effects are amplified during pregnancy. WHO (WHO, 2000) set guidelines at 30,000μg/m3 for 1 hour & 10,000μg/m3 for 8 hours, which is the same as the CAFE limit for 8 hours. Levels in Ireland are low.
Ozone:
Ozone is a natural component of the atmosphere. Most ozone is found high up in the stratosphere, the layer of the atmosphere between 12km and 50km above sea level. Stratospheric ozone is essential to life on earth as it protects us from harmful rays from the sun.
Ozone is also found in the troposphere (ground level), the layer of the atmosphere next to the earth. Exposure to high concentrations of tropospheric ozone causes chest pains, nausea and coughing in humans. Long term exposure to moderate concentrations reduce lung capacity and can worsen heart disease, bronchitis, emphysema and asthma. Ground level ozone contributes to the greenhouse effect and global climate change. Levels of ozone in Ireland are moderate.
-
What is the Fitness Check of AAQ?
There was a (2018) fitness check of the two Ambient Air Quality Directives (AAQ) (Directives 2008/50/EC and 2004/107/EC) initiated by the European Commission, Directorate-General for Environment (assisted by consultants such as Milieu and Eunomia). They are being reviewed because they have been in force over 10 years now (Commission, 2011). The fitness check centered on five evaluation criteria; relevance, effectiveness, efficiency, coherence and EU added value (as outlined in the Better Regulation agenda). The findings of the fitness check will inform the review of the AAQ deciding if they are fit for purpose and continue to protect the citizens of the EU, and their environment, from harm.
This fitness check process has had the following recommendations from public consultations (EC, 2018):
- Achieve existing limit standards as soon as possible and update standards to be in line with new WHO guidelines when published;
- Clarify requirements for AQ plans (include low emission zones LEZ);
- Provide clear guidance on monitoring networks (number of sites and positioning) and on citizen science projects;
- Revise the alert system to identify effective systems and ensure best practice is put in place by all member states;
- Enforce Euro standards for cars across all Member States and remove non-compliant cars from the market;
- Remove subsidies for polluting activities (i.e. diesel tax break in Ireland);
- Ensure all Members meet NEC Directive ceilings;
- Promote increased public participation and raise awareness about air pollution;
- Pursue timely infringement procedures where there is non-compliance with the AAQ Directives.
-
What is the Air Quality Index for Health (AQIH)?
The EPA’s Air Quality Index for Health (AQIH) is a number from 1 to 10 that tells the public what the air quality currently is in their region, and whether this might affect the health of you or your child. A reading of 10 means the air quality is very poor and a reading of 1 to 3 inclusive means that the air quality is good. https://www.airquality.ie
-
How do I use the Air Quality Index for Health (AQIH)?
Step 1: Read ‘What are the short-term effects of air pollution?’ to see if you or your child is likely to be at risk from air pollution. Your doctor may also be able to advise you.
Step 2: Figure out which Air monitoring station is nearest to you using the map, or which one best represents air quality where you are. Check the AQIH at that station if you think you are at risk, and are planning strenuous outdoor activity.
Step 3: Read the health advice messages for the current AQIH for your region.
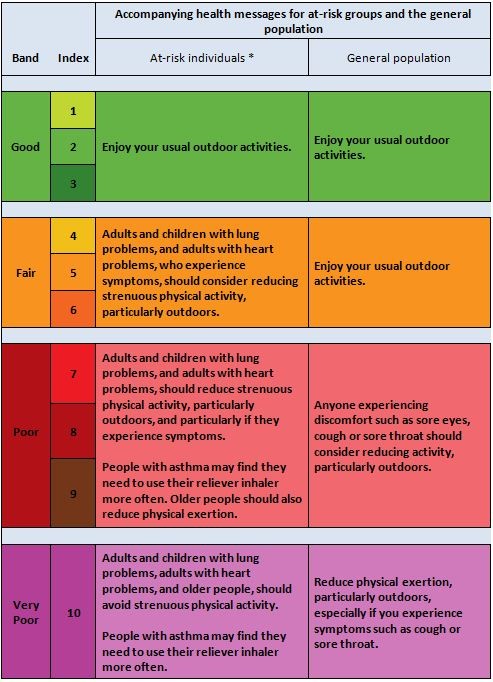
The AQIH health advice messages are messages to help you and your family better manage your health. The table below gives health messages for individuals who are sensitive to air pollution (at risk) and for the general population.
If you or child has heart or lung problems you are at greater risk of symptoms from air pollution. You need to follow your doctor's usual advice about exercising and managing your condition. If you are very sensitive, you may have health effects even on days when the air quality is good. Anyone experiencing symptoms should follow the guidance provided in the section on 'What can I do when there are increased levels of air pollution?'.
-
How is the AQIH calculated?
-
What are some useful websites where I can get information on air quality?
For further information on air quality please have a look at some of the following websites
-
How and why we monitor dioxins in Ireland?
Direct measurement for dioxins in ambient air is extremely difficult and no limits have been set in the EU CAFE Directive. The most appropriate method for assessing dioxin exposure in the air is to sample Dioxin levels in cows’ milk samples taken during the grazing season. The Environmental Protection Agency (EPA) has carried out a number of such surveys, at almost identical locations in the form of separate reports. These can be used as indicators for the actual average local dioxin exposure by atmospheric deposition. Studies/surveys have been carried out since 1995. The main source of dioxins is the illegal burning of waste. Maximum levels for dioxins, dioxin like PCBs and non‐dioxin‐like PCBs in foodstuffs including milk, are governed by Regulation, EU 1259/2011. The results of the surveys are reported in the annual air quality in Ireland reports on the air pages of www.epa.ie
Air Quality Forecast
-
What is the Air Quality Forecast and what does it forecast?
Air Quality Forecast Maps predicts daily air quality for:
- today,
- tomorrow, and
- the day after tomorrow.
Air quality is presented with different daily maps, including:
- Air Quality Index for Health (AQIH),
- Particulate Matter (PM) – both PM2.5 and PM10,
- Nitrogen dioxide (NO2),
- Ozone (O3).
-
Why do we need an Air Quality Forecast?
The forecast gives everyone in Ireland the air quality information they need to plan their outdoor activities to reduce potential exposure to poor air quality. The forecast also helps to increase awareness of air quality issues and to remind us all to take steps to reduce air pollution in Ireland.
-
How often is the Air Quality Forecast updated?
Twice a day, once in the morning (by 9:30) and once in the evening (by 19:30).
-
How is the Air Quality Forecast calculated?
We use two computer models to calculate air quality forecasts.
First, information from several sources is automatically entered into a computer model. It uses this information to calculate the air quality forecast for three days for each air quality station. This information consists of air pollutant measurements from:
- Air quality monitoring stations (together called the Ambient Air Quality Monitoring Network),
- Meteorological data like wind directions and speed,
- European air quality forecast data.
Second, the forecasts generated from this first model are fed into a second computer model. This second computer model uses other data such as land use and European forecast data to fill in the gaps between air quality monitoring stations.
The information from these two models combined gives us an estimate of the spread of pollutants across the country. We run these models twice a day and we report the findings on www.airquality.ie.