EPA’s assessments of water quality and agriculture
Learn more about the EPA's assessments of water quality and agriculture.
EPA's roles and responsibilities
Specific queries on the 'Interim Review of Water Quality'
EPA's roles and responsibilities
What is the EPA's role in water quality?
The EPA's purpose is to protect, improve and restore the environment through regulation, scientific knowledge and working with others. For water quality, the EPA's responsibilities include:
- monitoring and assessing the impact of human activities and pressures
- providing advice to the Minister on objectives and measures
- regulation of wastewater, industrial and waste activities and oversight of local authority performance of their statutory environmental functions
- reporting to the Commission under a range of directives including the Water Framework Directive, Nitrates Directive and the Bathing Water Directive
The EPA oversees and implements the national water quality monitoring programme. The programme is designed to assess the overall condition of our rivers, lakes, canals, estuaries, coastal waters and groundwaters and to meet the requirements of the Water Framework Directive and Nitrates Directive. Full details of the monitoring programme is available on our website Water Quality Monitoring Programme for the period 2022-2027.
What are our water quality objectives?
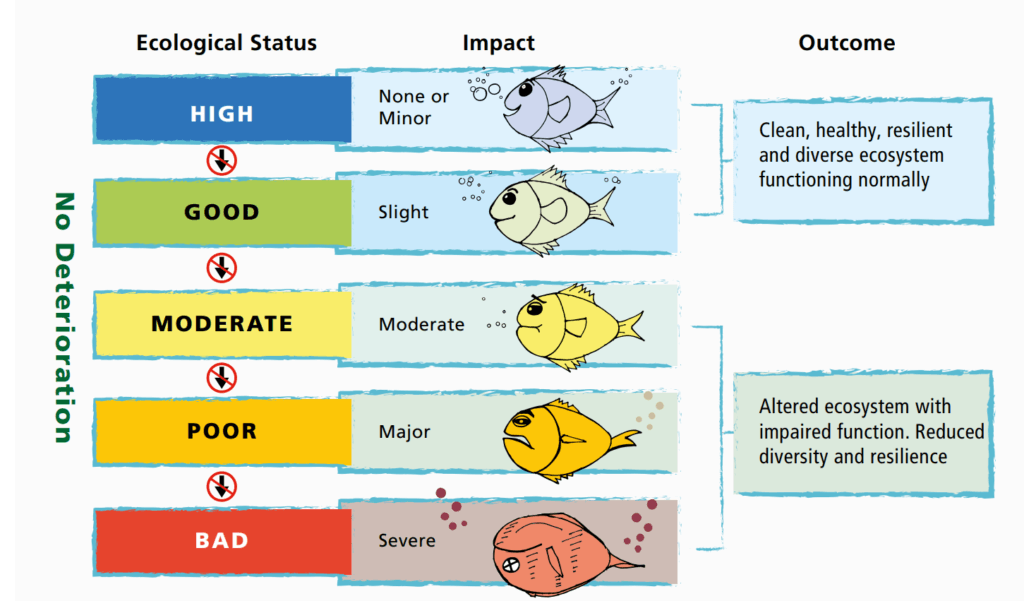
Our overall aim for water quality is to achieve good or high ecological status in all waterbodies. Waters in high and good ecological status show only minor or slight changes from natural conditions and we need to protect these. Waters in less than good status (moderate, poor or bad) range from moderately to severely damaged by pollution or habitat degradation and we need to improve these.
See our Factsheet - How we assess water quality for further information.
How many waterbodies are there and how many get monitored?
There are over 4810 surface and groundwater bodies in Ireland. This includes over 500 groundwater bodies, 3200 rivers, 800 lakes, 200 transitional waters, and 110 coastal waters.
Approximately 2900 (60%) of these waterbodies are monitored including 121 groundwater bodies, 2429 rivers, 224 lakes, 80 transitional waters and 45 coastal waters. There are also 16 canal waterbodies on the monitoring network.
Where monitoring data are not available, we assign ecological status using other methods. Explore further information on assigning status to unmonitored waters.
What does EPA monitor?
The programme provides an assessment of the ecological status and chemical status of surface waters (rivers, lakes, transitional and coastal waters) and the chemical status and quantitative status of groundwaters. Canals and heavily modified waterbodies are also included.
For surface waters, the programme includes:
- biological elements such as invertebrates, fish, algae and aquatic plants
- physio-chemical quality elements, e.g. nutrients, dissolved oxygen, pH and temperature
- chemical substances such as pesticides and metals
- hydromorphological quality elements which is the physical habitat condition of water bodies.
Factsheets on different elements of the monitoring programme are available here:
How often are waters monitored?
In general, nutrients are monitored between 3 and 12 times a year depending on the waterbody type. Most of the biological elements (e.g. fish, algae, plants) are monitored once every three years. Details of the monitoring frequencies for all the elements monitored are available on page 23 of our report on the Water Quality Monitoring Programme for the period 2022-2027.
EPA's water quality findings
How is water quality in Ireland overall?
The EPA publishes a full assessment of the condition of our waters every three years. The latest assessment is for the period 2016-2021 and a summary of the key findings is available on our website. This assessment shows that over half (54%) of our surface waters are in good or better ecological status which means that nearly half (46%) are in unsatisfactory condition.
The assessment showed that there was a relatively small decline in the water quality of our rivers and lakes. The number of water bodies in satisfactory condition in our estuaries and coastal waters declined by almost 16 percent and 10 percent respectively since the previous assessment (2013-2018). Overall, our water quality has been declining since the 2010-2012 assessment.
In the Water Indicators report for 2023 we reported that there was no significant change in the water quality indicators for 2023 and no significant improvement in water quality overall. Nitrate concentrations in the east, southeast and south remain too high. The quality of our water bodies will not improve until nutrient levels are reduced in areas where they are elevated.
What are the main pressures on water quality?
Our water quality is impacted by:
- excess nutrients (nitrogen and phosphorus) coming mainly from agriculture and urban waste water discharges, and
- the damage that various activities such as land drainage and urban development do to the physical condition of our water habitats.
Agriculture is the most prevalent significant pressure impacting over 1,000 water bodies, followed by impacts to the physical habitat conditions (453 water bodies impacted), forestry (232 water bodies impacted) and urban waste water (214 water bodies impacted). Further information is available in chapter 8 of our latest water quality assessment report.
How does the EPA assess what activities are impacting on water quality?
We first examine the monitoring data to determine the specific water quality issue. In relation to nitrate or phosphorus (or both), we quantify all the potential sources of the nutrient based on the human activities and the conditions in the catchment.
We use up to 140 datasets including information such as population size, the numbers and locations of septic tanks, and the level of treatment from wastewater treatment plants, animal numbers and their excretion rates, soil types, forestry, industrial and other activities. Where nutrients from agriculture are applied on land, we use Teagasc models to model how they behave as they move through the soils and the landscape. We include monitoring data upstream and downstream of wastewater treatment plants and other urban discharges. We assess the proportion and significance of each nutrient from each source to identify the significant pressures impacting on each water body.
The assessment is then 'ground-truthed' through extensive engagement with other public bodies with local knowledge including the Local Authority Waters Programme, the Local Authorities, and Inland Fisheries Ireland. These assessments inform the programme of measures in the river basin management plan.
What is happening to nutrient concentrations in our waters in recent years?
Nitrate
Nitrate concentrations in rivers and groundwaters fell during the 1990s and 2000s reaching their lowest concentrations in the early 2010s. Concentrations of nitrate then increased, reaching a peak in 2018-19. The 2018-19 peak arose because of a combination of the 2018 summer drought, and an increase in fertiliser use to encourage growth.
Annual average river nitrate concentrations nationally were the same in 2023 as in 2022 and there is no sign of an improvement.
The EPA sometimes reports nitrate levels as three-year rolling averages. It is important to remember the unusual peak in nitrate levels in 2018-2019 which increases the three average when those years are included.
Overall, nitrate levels are too high in 42% rivers, 17% estuaries and coastal waters to support good ecological condition, particularly in the south and southeast, and over the long term they are not decreasing. Up to date nitrate graphs are available in our latest Water Indicators report for 2023.
Phosphorus
During 2023, average levels of river phosphorus were too high (greater than 0.035 mg/l P) to support good ecological status in 27% rivers and 35% of lakes. The highest phosphorus concentrations i.e., greater than 0.05 mg/l P, are found in areas with poorly draining soils e.g., Limerick, Monaghan, the area north west of Dublin and Wexford. Phosphorus concentrations have been stabilising in recent years, albeit at too high a level to support good ecological status in some places. Up to date phosphorus graphs are available in our latest Water Indicators report for 2023.
What is the impact of too much nitrate and phosphorus in our waters?
Nitrate and phosphorus help plants grow. Too much of these nutrients in water can cause over growth of aquatic plants and algae which leads to eutrophication. The excessive growth out-competes other plants, uses up dissolved oxygen, and blocks light to deeper waters, leading to imbalances in the ecosystem.
Both phosphorous and nitrogen play a role in eutrophication. The general rule is that phosphorus is of most concern in our freshwaters, and nitrogen is of most concern in estuaries and coastal waters.
What are the standards for nitrate?
There are three different nitrate standards that apply in different circumstances, depending on what is being protected.
Ecological standards in rivers
EPA assessments indicate that nitrate levels should be less than 8 mg/l NO3 (or 1.8 mg/l as N) to support good water quality in our rivers. 44% of river sites have mean nitrate concentrations above this level. The southeast region has consistently had the highest nitrate concentrations over time.
Ecological standards in marine waters
The standard to protect the ecological health of marine waters is 11.5 mg/l as NO3 (or 2.6 mg/l as N). The latest assessment found that 20% of estuarine and marine waters that were sampled had nitrogen levels above this standard. The majority of these impacted waters are located along the south and southeast coast.
Drinking water standards
The standard to protect public health from elevated nitrate in drinking water is a maximum concentration of 50 mg/l as NO3. Irish waters perform relatively well against this standard. Just 6% of groundwater bodies and 1% of rivers have average nitrate concentrations greater than the threshold level of 37.5 mg/l as NO3. The threshold level of 37.5 mg/l as NO3 as an average concentration is set to minimise the risk that the maximum concentrations will exceed 50 mg/l as NO3. As can be seen above, much lower levels of nitrate are needed to protect the ecological health of our waters.
What levels of nitrogen reductions are needed to achieve good water quality?
Every catchment has a limit to the amount of nitrogen it can absorb and still remain healthy. We have exceeded that limit in the catchments in the south and southeast, and reductions are required.
In 2021 the EPA published an assessment of the catchments that need reductions in nitrogen emissions to water. There are a number of key catchments of concern with elevated nitrogen concentrations along the south, southeast and east coasts including the Maigue/Deel, Bandon, Lee, Blackwater, Suir, Nore, Barrow, Slaney, Tolka/Liffey and the Boyne river catchments.
The nitrogen load varies between catchments, and between years, and it is dependent on the amount of excess nitrogen available for leaching in the catchment, and the effective rainfall that delivers it through the landscape and dilutes it in the river. The level of reduction required therefore varies between catchments and years. For example, the assessment shows that up to 8,000 tonnes of N reduction in water is needed in the Barrow catchment in some years. Learn more about this on the catchments.ie website.
Specific queries on the 'Interim Review of Water Quality'
Why was an interim water quality review carried out?
The Commission's Implementing Decision (2022/696) approved Ireland's current nitrates derogation. It also included a condition (Article 12) that an interim water quality review be carried out in 2023, in accordance with a specific set of criteria. These criteria required that in areas where waters are polluted, at risk of pollution, or showing stable or worsening trends, with respect to both nutrient conditions and trophic status, additional measures must be applied under the Nitrates Action Programme by 1 January 2024. For farms in these areas that have been granted a derogation, the amount of manure that may be applied to the land shall not exceed 220 kg nitrogen/ha per year.
The EPA was assigned the role to carry out the interim water quality review as part of our role in monitoring, assessing and reporting water quality under the Good Agricultural Practice Regulations SI 393 of 2022. The assessment was required to be submitted as an Annex to the Annual Report on Nitrogen and Phosphorus Concentrations in Irish Waters by 30 June 2023 to Department of Agriculture, Food and the Marine.
What monitoring data were used in the interim water quality review?
The Commission's Implementing Decision requires the EPA to use the Nitrates Directive monitoring network for the review. This is a subset of the overall EPA monitoring data and is essentially the surveillance monitoring network which was established to provide a comprehensive and long-term picture of water body status across the State. Further information on the surveillance network is available in our report on the Water Quality Monitoring Programme for the period 2022-2027. The full monitoring network was used in the Annual Report on Nitrogen and Phosphorus Concentrations in Irish Waters.
What are the EU Commission's criteria for this interim water quality review?
The Commission set four water quality tests. The tests were as follows:
Where monitoring data reveals:
- a1) average values of nitrate concentrations above 50 mg/l.
- a2) increasing trends of nitrates concentration in 2022 compared to 2021. An increasing trend is defined in the Commission reporting guidance as an increase of >1 mg/l NO3 between reporting periods.
- b1) 'Eutrophic' status.
- b2) 'Could become eutrophic' status with a stable or worsening trend in 2022 compared to 2021.
these waters are considered polluted, or at risk of pollution, or showing worsening trends. The Commission Implementing Decision states that in the lands draining to these waters, additional measures shall apply, including a reduction in the maximum allowable rate of application of organic manures from 250kg N/ha to 220kg N/ha.
The EPA carried out the assessment in the manner prescribed and found that 44,000 km2 of agricultural lands have met the Commission's water quality criteria and will therefore require additional measures.
The EPA has published a document outlining the technical methodology for how this assessment has been carried out. The assessment data and the map are available for download on the EPA's data portal.
Why does the red map exclude places where there are many derogation farms?
The Commission Implementing Decision specifies that the data used for the assessment must be based on the Nitrates Directive monitoring network, which is the network used for reporting under the Nitrates Directive since 1991. The Nitrates Directive Monitoring Network is a subset of the EPA's full national water quality monitoring network which is used for all other EPA reports. This means that some areas with a high number of derogation farms, for example in Cork, and which need to reduce nitrogen losses to water, are not included on the red map because they don't have a monitoring station in the Nitrates Directive monitoring network.
Why does the red map include places where there are no derogation farms?
The red map also includes areas which do not have many derogation farms, for example in the west of Ireland. This is because the Commission criteria include an assessment of eutrophication. In Ireland, both phosphorus and nitrogen play a role in determining eutrophication. Areas with excess nitrate and/or excess phosphorous levels leading to eutrophication are therefore included in the red map. This brings in waterbodies that are impacted by agricultural run-off from all farming types, not just derogation farms.
Why are areas north of the border included in the red map?
Some rivers cross the border between Ireland and Northern Ireland. The EPA has monitoring stations on the south of the border that have their catchment areas in the north. The Commission's criteria required that 'all areas draining to' be included, therefore this includes some catchment areas north of the border. It is important to note that the 'red map' is not the final map showing which farmers are affected by changes in the derogation. The final map has been published by the Department of Agriculture, Food and the Marine.
Will measures in the areas covered by the red map deliver water quality improvements?
The red map captures the areas that meet the criteria set out as part of the Commission's Implementing Decision. These are the areas where additional agricultural measures are required to improve water quality. The Commission has specified that a reduction in the maximum organic loading on derogation farms must be one such measure, but that additional measures will be needed.
While the Commission's measure to reduce the nitrogen loading is well suited to areas requiring reductions in nitrate leaching, on its own it is unlikely to address all the water quality issues. Reductions in nitrate leaching are also likely to be needed from non-derogation farms. High phosphorous levels will also need to be addressed.
To support the policy makers in their decision making on additional measures, the EPA's Farm and Landscape measures for Agriculture map was included as part of the review.
What is the EPA's Farm and Landscape measures for Agriculture map?
The EPA's Farm and Landscape measures for Agriculture map has been developed to help address the specific water quality issues arising from agricultural run-off in waterbodies that are not meeting their water quality objectives. In particular, it highlights where targeted measures to address nitrate, phosphorus and sediment losses are required as well as potential farm point source issues. This map is based on the full national monitoring network and includes the impact from all types of farming activity.
Are derogation farms the reason for the problems with nitrates?
The key factor for nitrogen loss is the level of surplus nitrogen use, on farms located on the highest risk soils in the catchment. The highest risk soils for nitrogen losses are the freely draining soils in the south and southeast. These soils in that part of the country tend to support the higher value, more intensive dairy farming. However, all farms on risky soils in these areas have a role to play to reduce nitrate concentrations in waters, because it is the cumulative amount of nitrogen from the entire catchment that determines the extent of the impact on water quality.
What about the lag time between measures and water quality changes?
There are three main factors or drivers that govern nitrogen losses to water from farms; these are farm practice, soil type and climate. Nitrogen losses are greatest where there is intensive farming with excess nitrogen use in the freely draining soils and when the summer is dry and the winter is wet. In 2018 we had this scenario and the response in water quality data was almost immediate, in the winter of 2018 and spring of 2019. So the lag time in Ireland (at a national level) between changes in nutrient losses and the responses in nutrient concentrations is less than 12 month.
This national finding is supported by more detailed research in the Teagasc Agricultural Catchments Programme (McAleer, 2022). The biology can take longer to recover. The key factor to improve water quality and see nitrate reductions is to get 'the right measure in the right place'. There needs to be a high uptake of measures to reduce nitrogen losses and the measures need to be implemented in the most risky areas.