National Land Cover Map
A new Land Cover Map is available for Ireland. It was released on 21 March 2023.
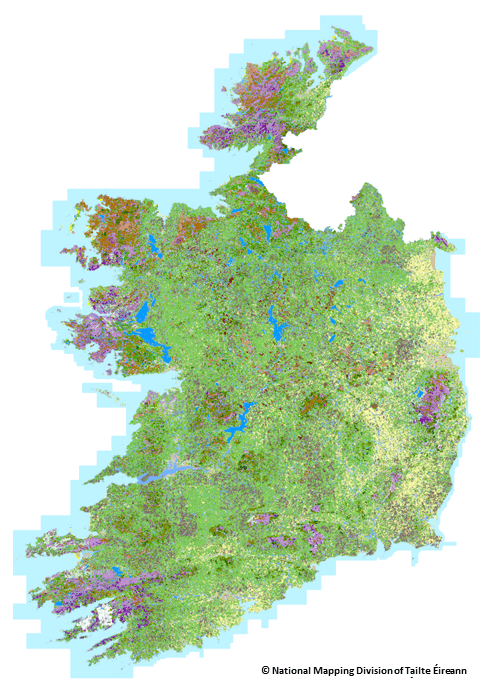
Figure 1: Outline of the new National Land Cover Map for Ireland (NLC 2018).
The new National Land Cover Map was produced by the National Mapping Division of Tailte Éireann (formerly Ordnance Survey of Ireland) in partnership with the Environmental Protection Agency (EPA). The aim of a land cover map is to map what is physically present on the Earth’s surface, for example forests, grasslands, and artificial areas. This Land Cover Map was produced based on 2018 data and is known as NLC 2018. The map includes very detailed information on land cover types in Ireland and marks a significant improvement in land evidence. It will have many uses in environmental assessments on water, climate, air, noise, and biodiversity and will be an important resource into the future.
NLC 2018 is available from the Tailte Éireann, for further information please visit the Tailte Éireann website to link with the official Tailte Éireann Land Cover Map web page.
In addition to the data a National Land Cover Map 2018 - Final Report is also available. It provides details on how NLC 2018 was produced, the accuracy of the data and an initial assessment on how it changes our understanding of land cover statistics in Ireland. Below we provide more information on NLC 2018 summarising much of the information from the Final Report.
What is land cover?
To understand land cover better a useful explanation is that it refers to what is physically present on the Earth’s surface. This includes surfaces like natural vegetation, freshwater and non-living surfaces. Grasslands, forest areas and artificial surfaces, are all examples of land cover types.
It is important to note that land cover is different from land use. Land use specifically refers to how that land is used or the activity at that location. Uses can be environmental, economic, or social and are usually a result of human intervention or management. Figure 2 below aims to conceptually highlight the differences between land cover and land use.
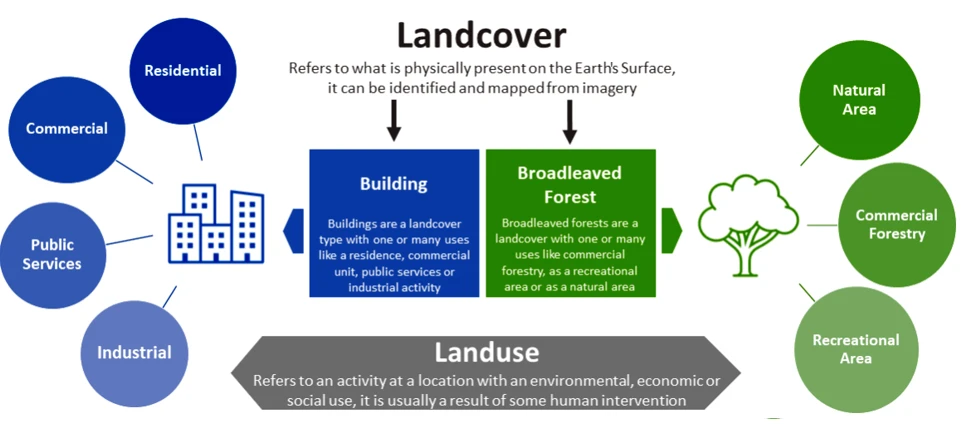
Figure 2: Understanding the difference between land cover and land use (Source EPA).
Understanding the types of land cover in Ireland
In creating the National Land Cover Map, it was important to define all land cover types that can be mapped from the data available in Ireland. To achieve this, the EPA and Tailte Éireann both engaged with experts from across the land sector, while also looking at existing international standards, to help define a Land Cover Classification System for Ireland.
The Land Cover Classification System contains two levels of classification with 8 classes at Level 1, and 36 classes at Level 2. The Level 2 classes were used to produce NLC 2018 and can be aggregated into Level 1 classes. Table 1 provides an overview of the Land Cover Classification System for Ireland which will soon be officially published by the EPA.
| Code | Level 1 | Code | Level 2 |
|---|---|---|---|
| 100 | ARTIFICIAL SURFACES | 110 | Buildings |
| 120 | Ways | ||
| 130 | Other Artificial Surfaces | ||
| 200 | EXPOSED SURFACES | 210 | Exposed Rock and Sediments |
| 220 | Coastal Sediments | ||
| 230 | Mudflats | ||
| 240 | Bare Soil and Disturbed Ground | ||
| 250 | Burnt Areas | ||
| 300 | CULTIVATED LAND | 310 | Cultivated Land |
| 400 | FOREST, WOODLAND AND SCRUB | 410 | Coniferous Forest |
| 420 | Mixed Forest | ||
| 430 | Transitional Forest | ||
| 440 | Broadleaved Forest and Woodland | ||
| 450 | Scrub | ||
| 460 | Hedgegrows | ||
| 470 | Treelines | ||
| 500 | GRASSLAND, SALTMARSH and SWAMP | 510 | Improved Grassland |
| 520 | Amenity Grassland | ||
| 530 | Dry Grassland | ||
| 540 | Wet Grassland | ||
| 550 | Saltmarsh | ||
| 560 | Sand Dunes | ||
| 570 | Swamp | ||
| 600 | PEATLAND | 610 | Raised Bog |
| 620 | Blanket Bog | ||
| 630 | Cutover Bog | ||
| 640 | Bare Peat | ||
| 650 | Fens | ||
| 700 | HEATH and BRACKEN | 710 | Bracken |
| 720 | Dry Heath | ||
| 730 | Wet Heath | ||
| 800 | WATERBODIES | 810 | Rivers and Streams |
| 820 | Lakes and Ponds | ||
| 830 | Artificial Waterbodies | ||
| 840 | Transitional Waterbodies | ||
| 850 | Marine Water |
Table 1: The National Land Cover Classification System for Ireland.
How was the map developed?
With a National Land Cover Classification System providing the clarity on what needs to be mapped, a production methodology was developed by the EPA and Tailte Éireann to allow the map to be produced.
This was achieved using earth observation and machine learning technologies to analyse a combination of Tailte Éireann aerial imagery, existing national datasets and Sentinel 2 satellite imagery from the Copernicus Space Programme funded by the European Commission.
Highly trained expert operators actively managed these models using iterative processes and checks to ensure the accuracy of the data being produced. Each land cover class was mapped at a minimum mapping unit of less than 0.1-hectare, i.e., the data resolution. This is over 250 time more detailed than CORINE 2018, produced at a 25-hectare resolution, and previously the most commonly used land cover dataset prior to NLC 2018.
Further details of how the map was developed are available at the Tailte Éireann website.
National land cover 2018 mapping examples
The level of detail available within NLC 2018 is a significant improvement on previous data. To get a better understanding of this Figures 4 & 5 highlight the differences between NLC 2018 and CORINE 2018.
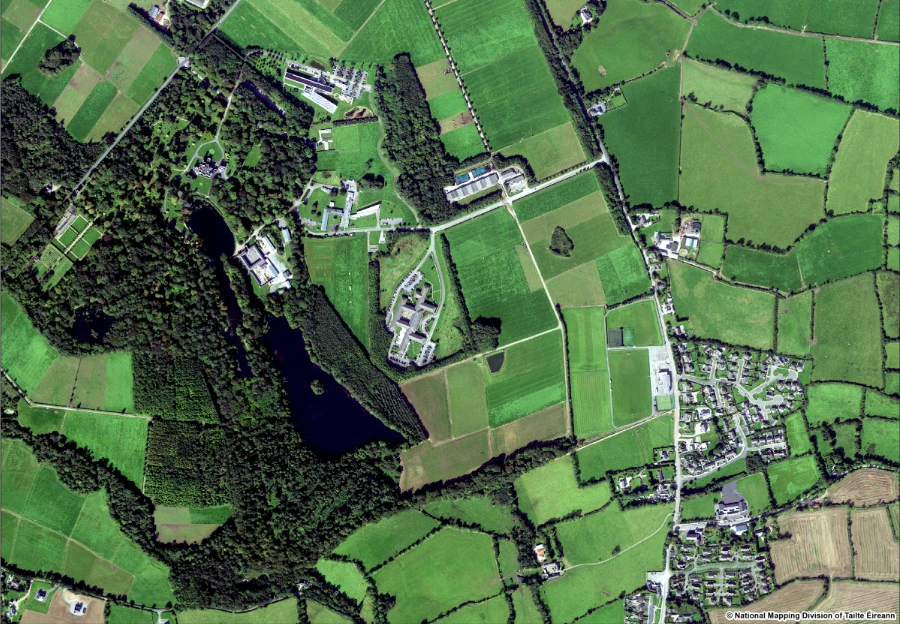
Figure 3: Tailte Éireann aerial image of Johnstown Castle Estate, EPA Headquarters, Co. Wexford.
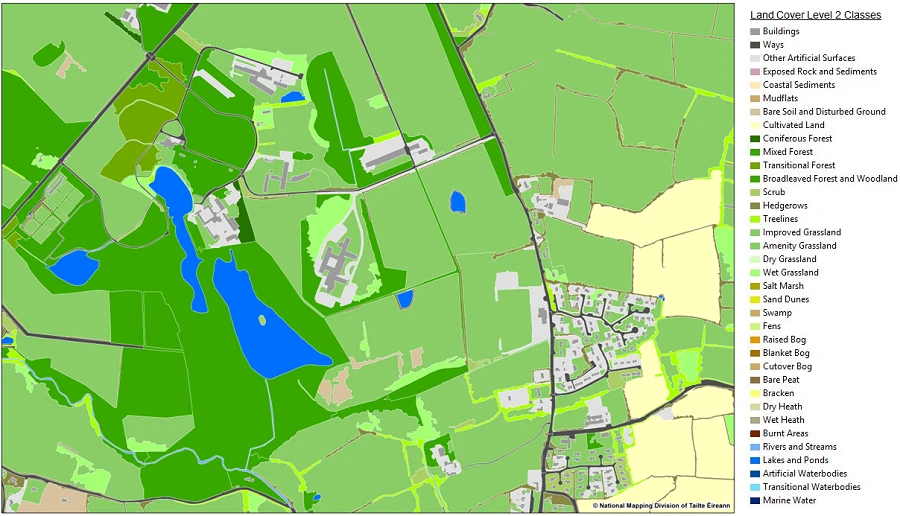
Figure 4: Shows the detail now available in the National Land Cover Map (NLC 2018) for Johnstown Castle Estate, EPA Headquarters, Co. Wexford.
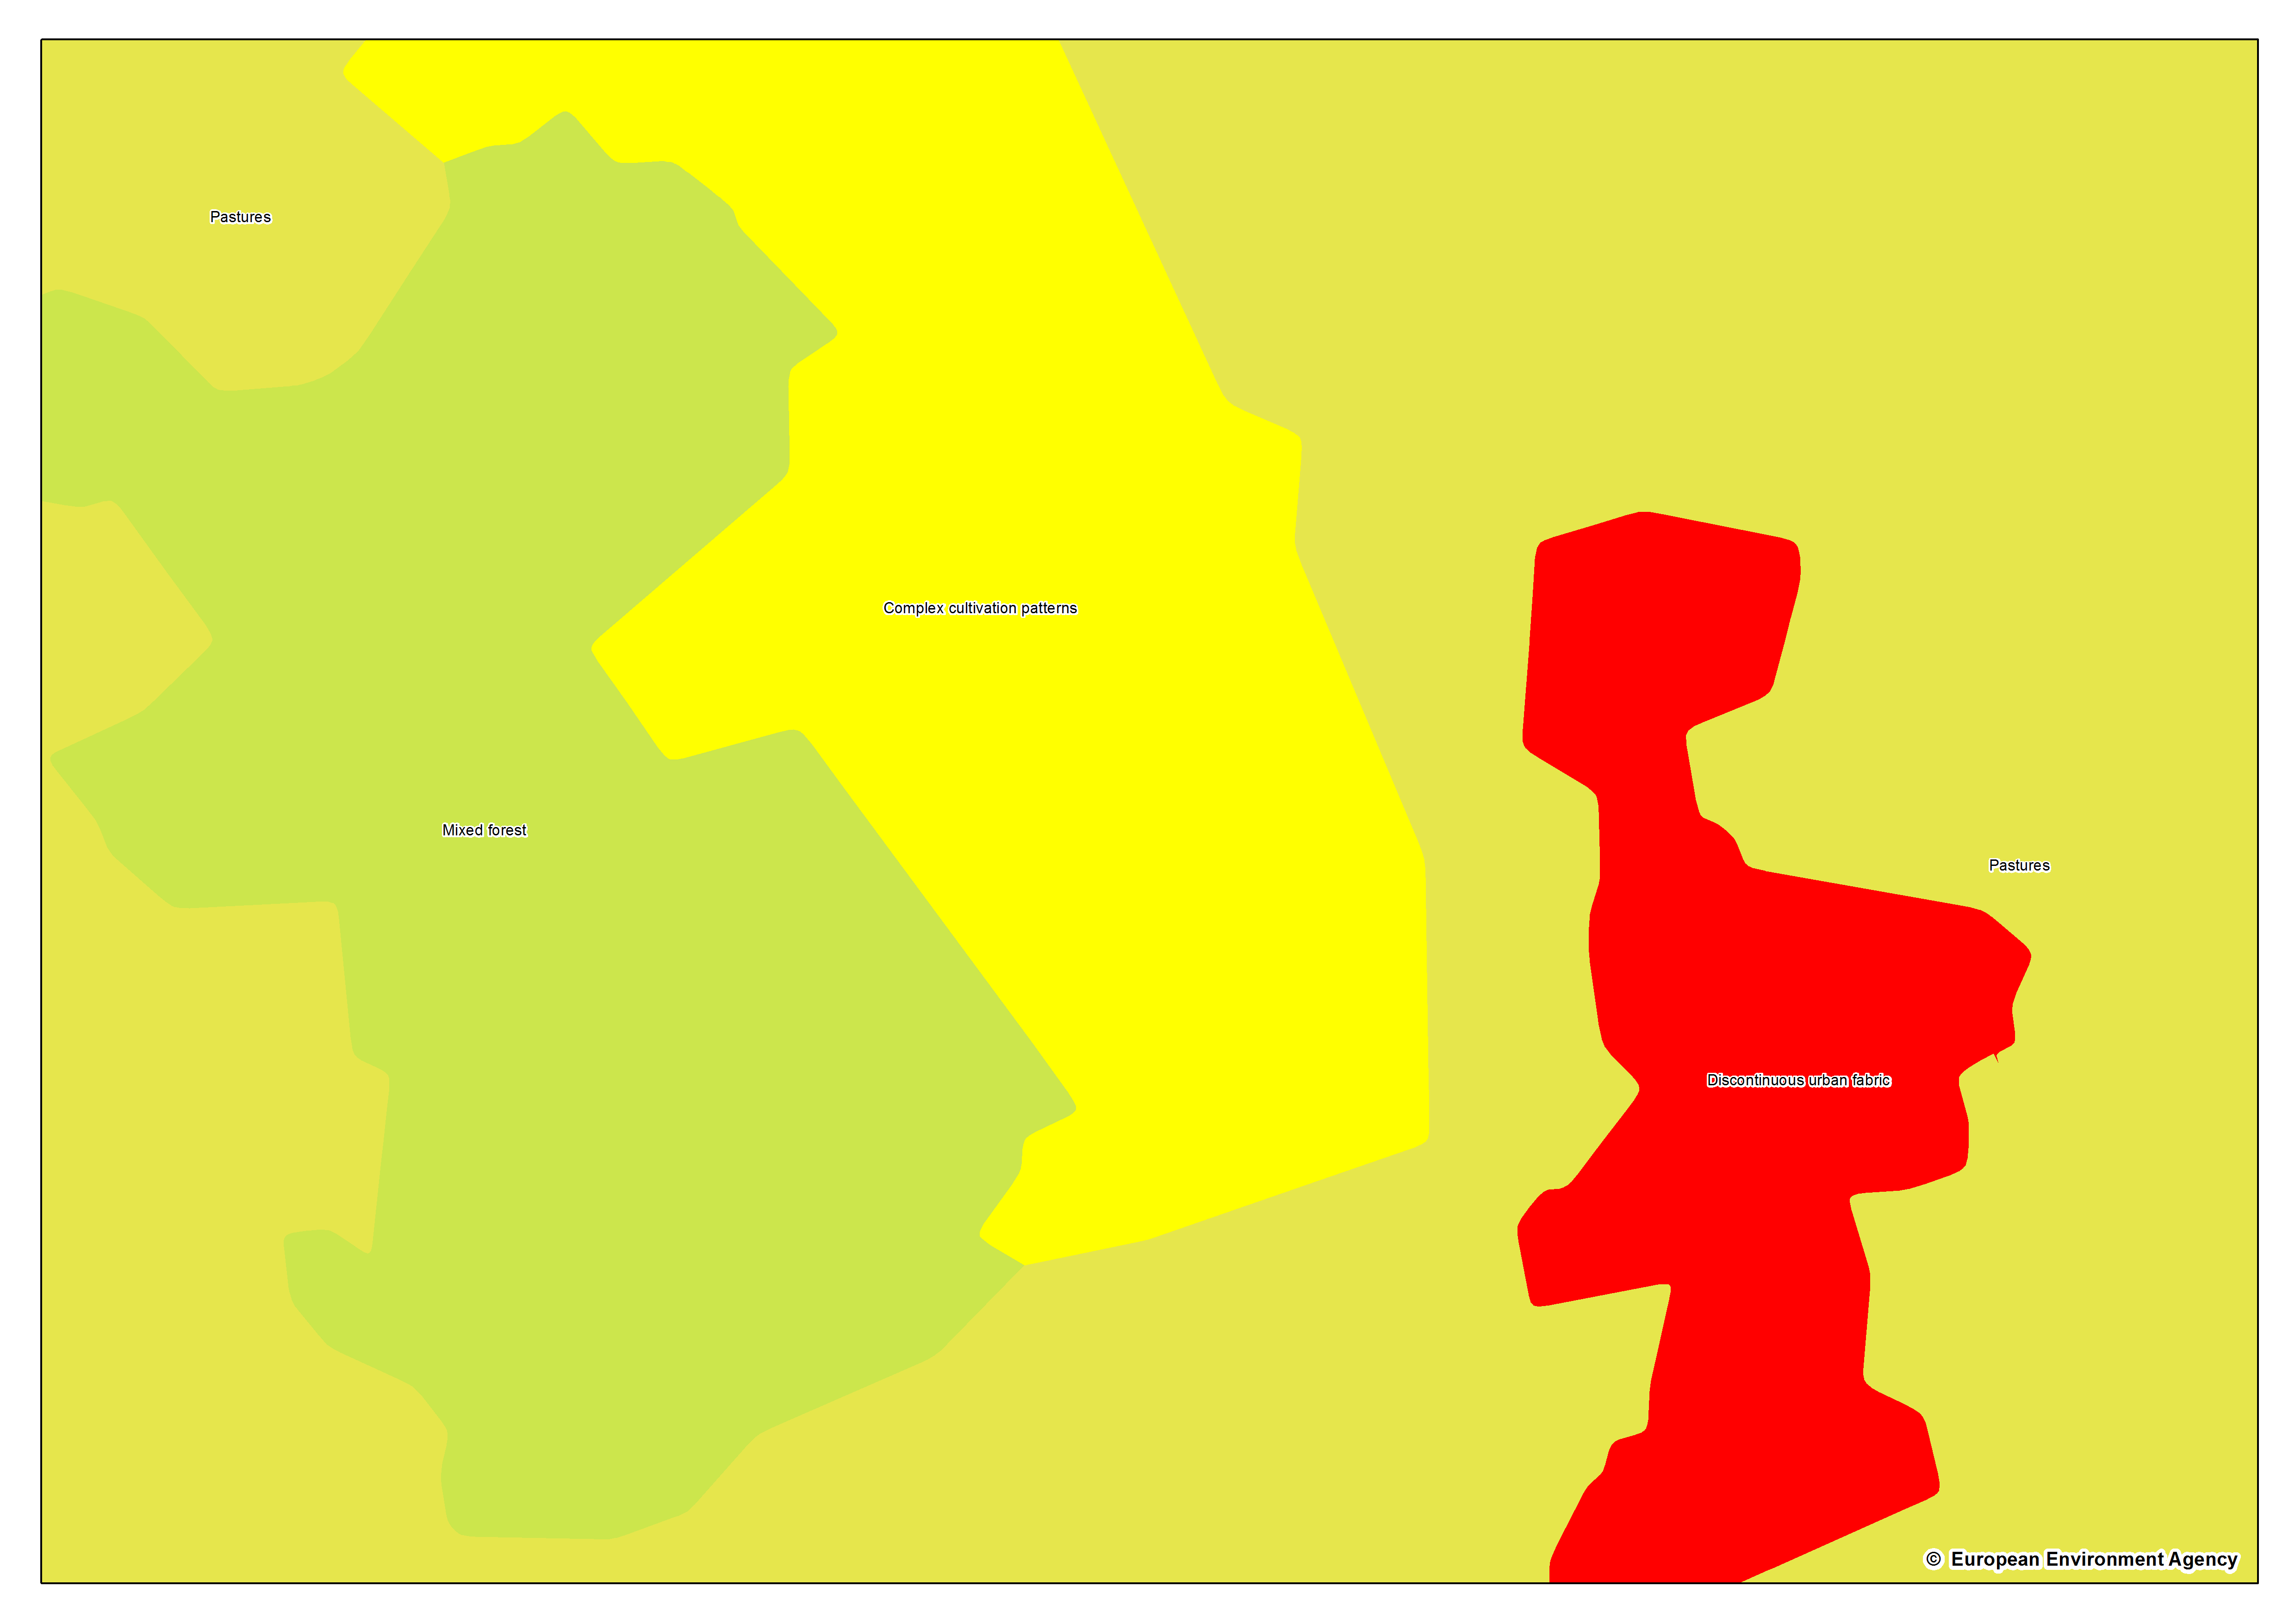
Figure 5: Shows the reduced detail of the CORINE 2018 data for Johnstown Castle Estate, EPA Headquarters, Co. Wexford.
Although there is less detail in CORINE data it provides a time series of information with data produced for 1990, 2000, 2006, 2012 and 2018. This provides important information as an indicator on how land cover has changed over time in Ireland. CORINE will also be produced into the future under the Copernicus Land Monitoring Service to preserve this valuable function.
Defining the accuracy of national land cover 2018
Greater detail in land cover mapping is welcome and will help develop a better understanding of our environment. However, all maps contain errors meaning it is important to define the accuracy of the data and understand the limitations that exist within the data.
In producing NLC 2018, a very comprehensive independent validation programme was established. This included assessment of over 22,000 data samples evenly distributed across all land cover classes. Samples were assessed, by independent stakeholders, for both class accuracy and geometric accuracy.
Once completed the samples were assessed by the EPA and CSO. The results of this assessment show that NLC 2018 has a high level of accuracy at both the Level 1 and 2 land cover classes. Overall accuracy, where all classes are combined into a single mean accuracy, shows that the data has a thematic accuracy (i.e., class accuracy) of 78.5% and 88.7%, at Level 2 and Level 1 respectively, while the geometric accuracy (i.e., area outline) is 87.2% - the same geometries apply to both classification levels.
| Accuracy Metric | Class | |
|---|---|---|
| Level 1 | Level 2 | |
| Thematic Accuracy* (%) | 88.7 ± 3.7 | 78.5 ± 3.9 |
| Geometric Accuracy (%) | 87.2 ± 22.5 | 87.2 ± 22.5 |
*Thematic accuracy is measured using the F1 score metric
The validation data has also been assessed at each individual class, meaning users can identify and take account of the performance of each class within NLC 2018. Charts 1 & 2 highlights the varying performance of Level 2 classes in terms of their thematic and geometric accuracy. From this we can see that there are many classes that perform very well with accuracies >80% and a few classes that perform less well with scores closer to 60% thematic accuracy. In general, most classes perform very well in terms of geometric accuracy.
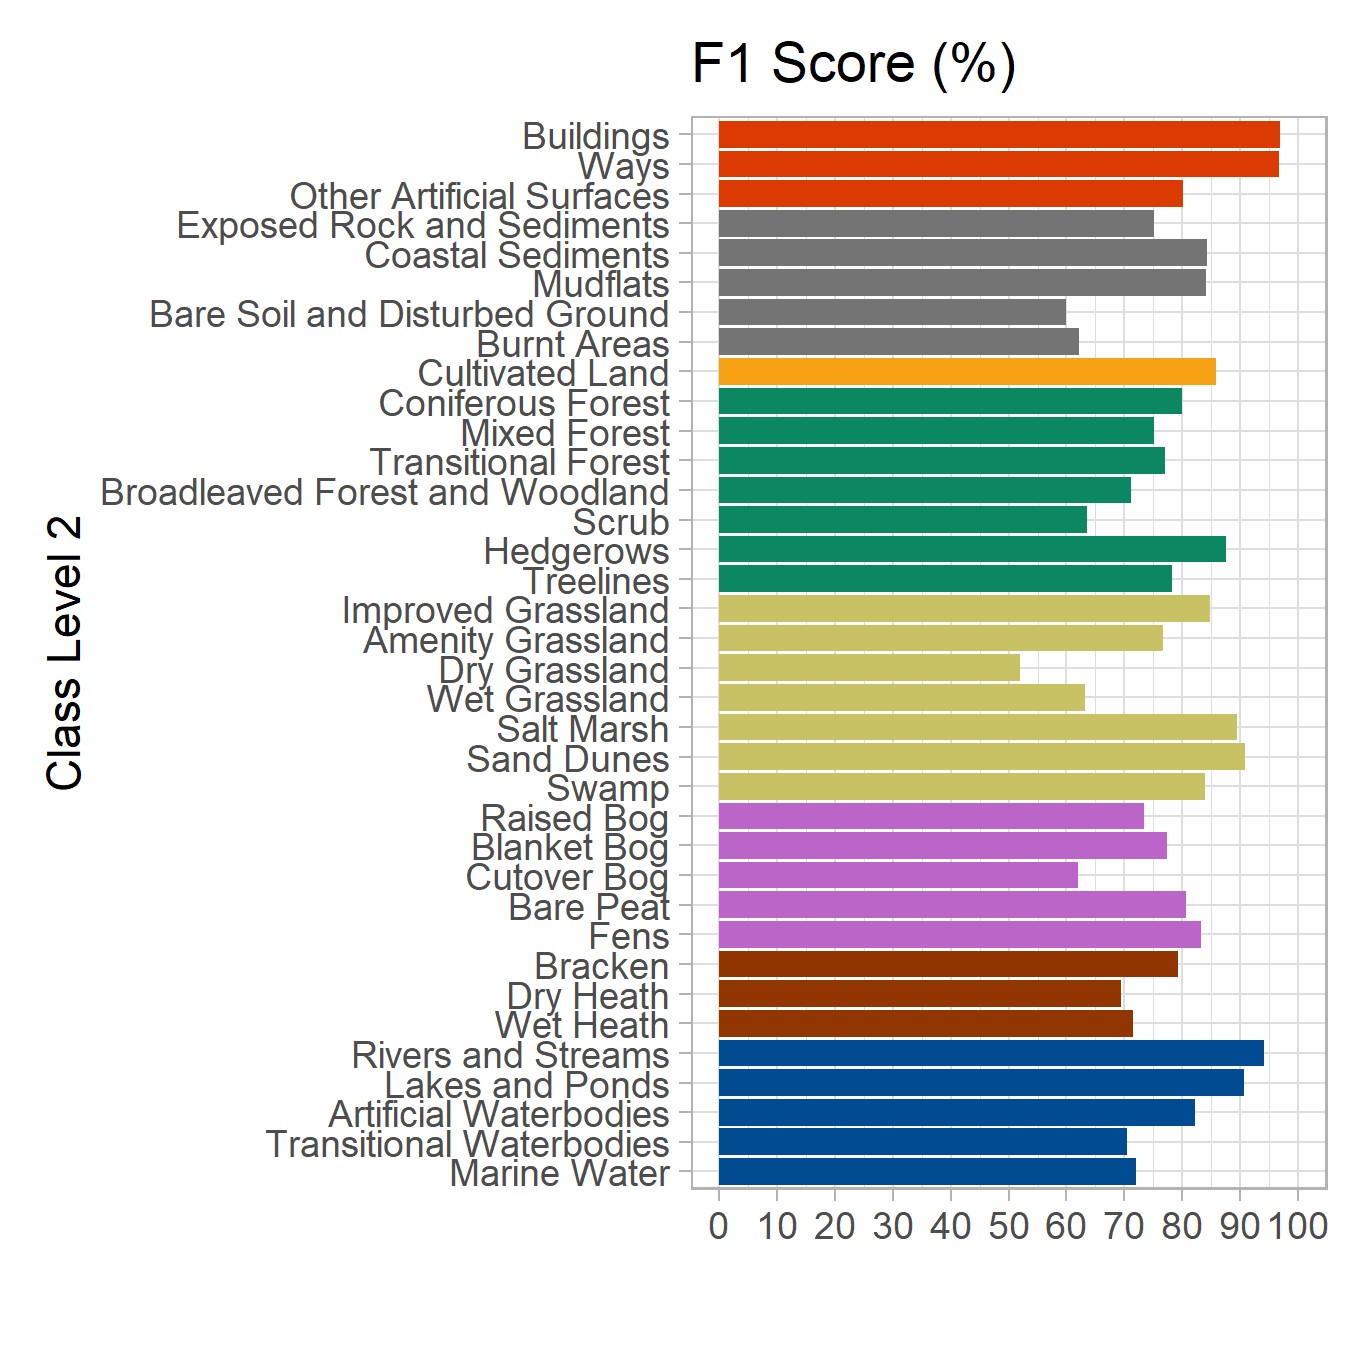
Chart 1: Thematic accuracy for Land Cover Level 2 Classes.
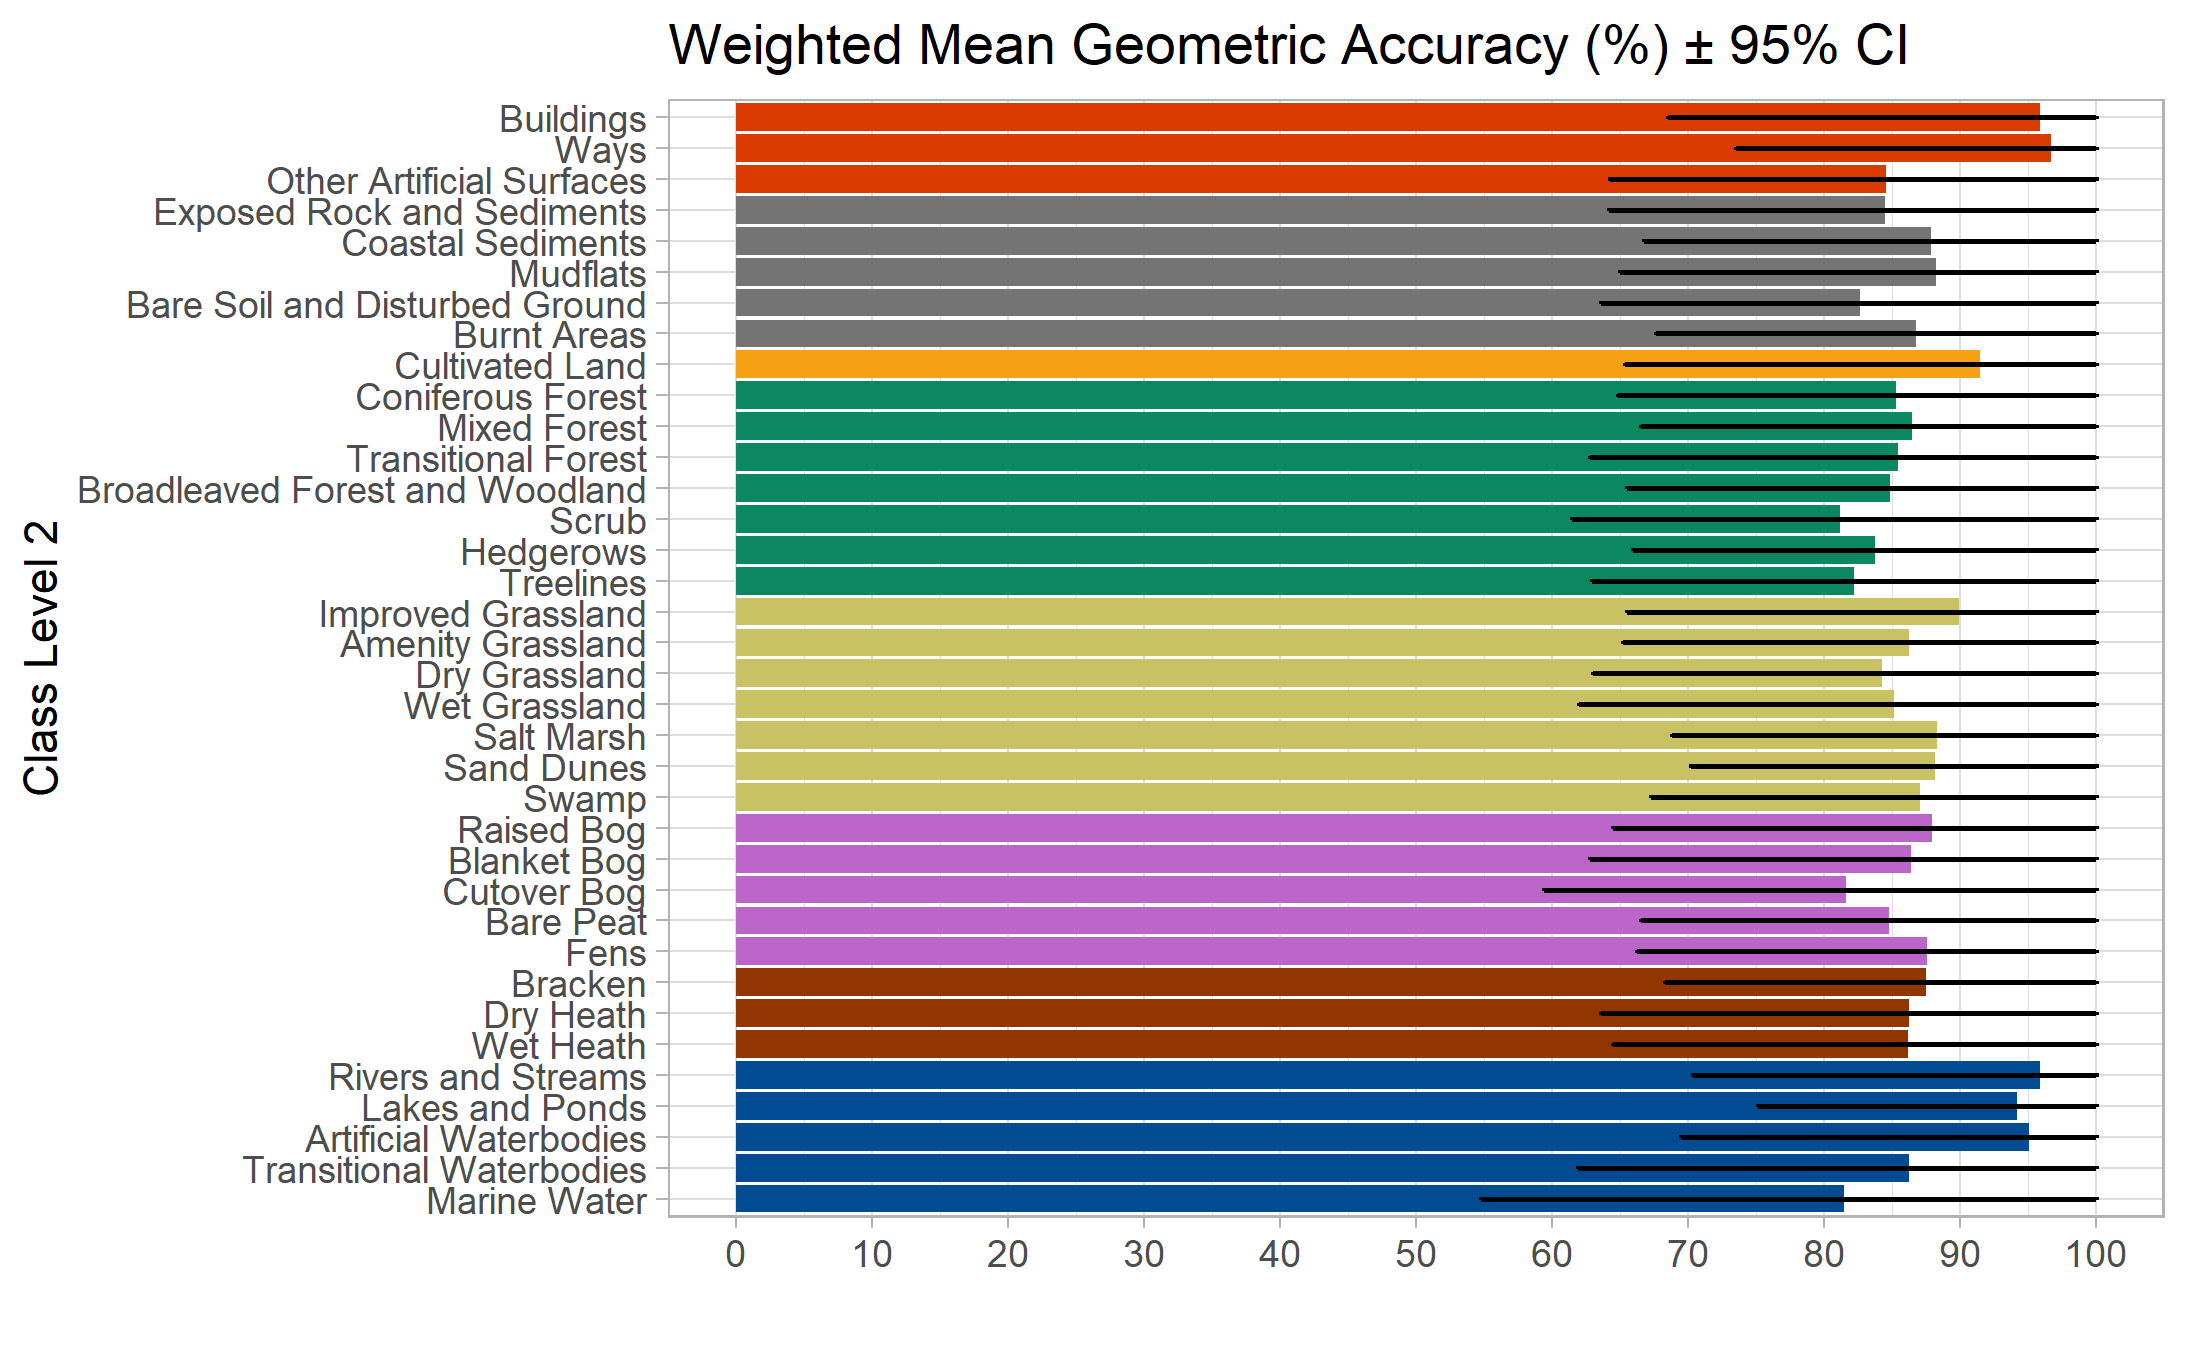
Chart 2: Geometric accuracy for Land Cover Level 2 Classes.
Further details on the validation programme and the assessment of the accuracy of the map are available at the Tailte Éireann website.
The EPA will also be publishing a more in-depth analysis of the accuracy assessment results in 2023.
How does national land cover 2018 change our understanding of land cover in Ireland?
With the significant change in the detail of the land cover data, now available in NLC 2018, our understanding of national statistics in land cover are also changing. The Final Report for NLC 2018 provides an initial assessment of the national statistics for land cover based on this new data, below are a summary of these findings.
When comparing the NLC 2018 and CORINE 2018 data at Level 1, as shown in Chart 3, it highlights that Grassland and Peatlands were overestimated in CLC 2018, while Forest Areas, Cultivated Land, Heath and Bracken, and Artificial Surfaces were underestimated.
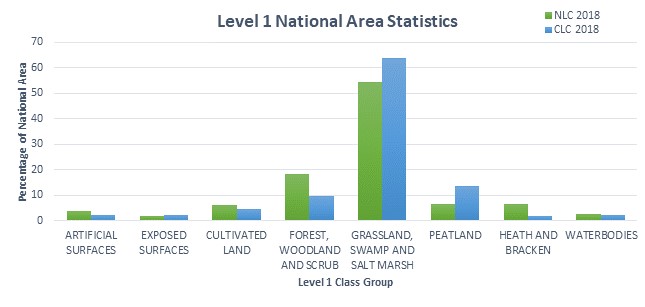
Chart 3: Comparison of percentage national area at Level 1 class groupings for NLC 2018 and CORINE 2018.
A lot of the changes identified are as a result of the differences in the resolution of the data. CORINE 2018 has a low resolution of 25-hectares meaning that many smaller land cover classes are generalised into the dominant classes. Small features like hedgerows, ponds, houses etc. are often merged into dominant classes like grasslands in Ireland. In NLC 2018 the data resolution is much more detailed meaning these small features are mapped, this increases the representation of these classes and decreases the percentage area of dominant land cover classes. In summary NLC 2018 is more representative of all land cover classes in Ireland.
Although these dominant classes are lower in area than previously calculated, they are still the most common classes in Ireland. Chart 4 provides an overview of the percentage of national area that each NLC 2018 Level 2 class represents, please note these are draft figures at this stage.
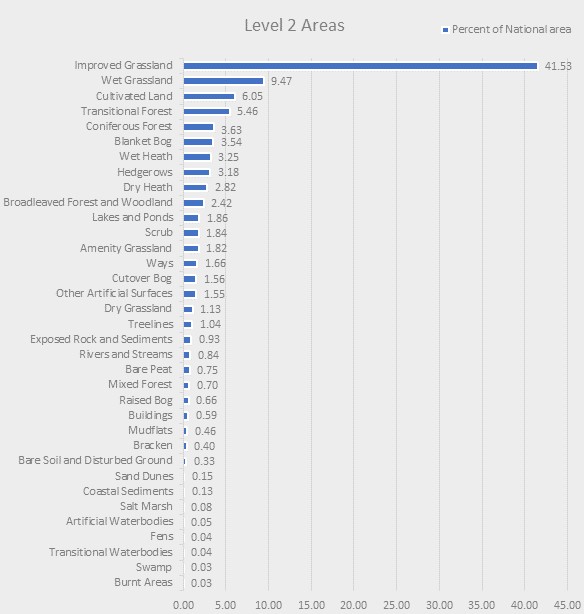
Chart 4: Overview of the percentage of national area that each NLC 2018 Level 2 class represents.
Chart 4 shows that by a large margin, Improved Grassland is the single most dominant land cover type in Ireland. It covers 2.93 million hectares or 41.53% of the total national area. It is the only class that exceeds 10% of the national area with the second most widespread class being Wet Grassland at 9.47%. These two grassland classes together account for over 50% of the national area.
Cultivated Land is the third most dominant land cover type in Ireland 6.05%, the map also shows it has a strong regional concentration in the East and Southeast. Transitional and Coniferous forest lands, both associated with plantation forestry account for 5.46% and 3.63% of the national area respectively. Blanket Bog and Wet Heath occupy 3.54% and 3.25% of the national area respectively.
The first national scale mapping of hedgerows in Ireland show that they cover 224,787 ha or 3.18% of the total national area.
All other classes are below 3% of the national area with full national-scale mapping achieved for the first time for many other land cover classes including Dry Heath (2.82%), Broadleaved Forest and Woodland (2.42%), Scrub (1.84%), Amenity Grassland (1.82%), Cutover Bog (1.56%) and Raised Bog (0.66%).
Acknowledgements
The EPA and National Mapping Division of Tailte Éireann would like to thank the considerable support that was provided by key stakeholders throughout the project, in particular the following organisations:
- National Parks & Wildlife Service
- Teagasc
- Department of Agriculture, Food, and the Marine
- Central Statistics Office
- Atlantic Technical University
- Botanical, Environmental & Conservation (BEC) Consultants Ltd
- The Heritage Council
- Geological Survey of Ireland
For further on any of sections covered above refer to the National Land Cover Map 2018 - Final Report on Tailte Éireann website.
Further information on access to the data visit Tailte Éireann or contact corporatesales@tailte.ie.