Did you know?
- Ireland has more than 73,000 km of river channels. If placed end-to-end, they could encircle the Earth almost twice. Three-quarters of these channels are very small streams that typically flow into larger rivers.
- The longest and largest river in Ireland is the Shannon. It runs for more than 360 km from its source to the sea and discharges on average more than 200,000 litres of water per second into the Shannon estuary at Limerick, where it enters the sea. That is the same volume as five Olympic-sized swimming pools every minute!
- Half of all the endangered freshwater pearl mussels in Europe live in Irish rivers. Riverbanks provide wildlife corridors through the countryside and give food and shelter for a wide range of animals and plants. They also serve as an important habitat for many wildflowers that support butterflies and bees.
- Biological monitoring has been carried out in Irish rivers since 1971. The current national river monitoring programme covers more than 13,000 km of river channel.
National Rivers Monitoring Programme
The national rivers monitoring programme is run by the EPA and focuses on the main river channels, rather than smaller streams. The programme includes more than 2,800 sites sampled for biology. Almost half of these are also sampled for physical (e.g. oxygen content) and chemical (e.g. nitrogen and phosphorus) parameters.
What is monitored?
The biological monitoring assesses:
- Invertebrates (animals without a backbone, such as mayflies or worms)
- Aquatic plants
- Diatoms (a type of algae)
- Fish (monitored by Inland Fisheries Ireland)
The physical and chemical parameters measured in the field and laboratory include:
- Dissolved oxygen
- Nutrients, such as nitrogen and phosphorus
- Hazardous substances
- Temperature
- pH (acidity)
The hydrological parameters include water level and flow.
The biology is monitored once every three years, while the physical and chemical parameters are measured several times a year. We monitor river levels and flows continuously, and any changes in the physical structure of the river channel are also recorded.
For technical information on our survey methods and our detailed monitoring programme, please see our report.
River water assessment
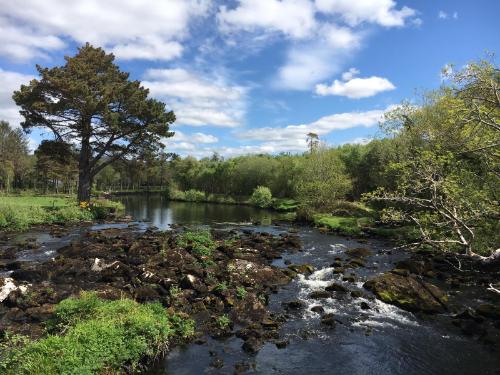
Healthy rivers are an important natural resource as they:
- Support many species and habitats
- Provide a source of clean water for domestic, agricultural and industrial use
- Support recreational activities and tourism
The quality of our most polluted rivers has improved when there has been:
- Better urban wastewater treatment
- A reduction in the loss of nutrients, such as phosphorus and nitrogen, from agricultural lands
Nevertheless, while river water quality in Ireland compares favourably to that in Europe, we continue to see a worrying trend in the loss of our highest quality river sites and an increase in the number of poor quality sites.
The water quality at half (50%) of the monitored river water bodies in Ireland is categorised as being at ‘good’ and ‘high’ ecological status. The remaining half are at less than good (50%). Almost one fifth (18.5%) of monitored river water bodies are in poor or bad status and are severely polluted. There has been a 1% decline in the ecological health of monitored river water bodies since the 2013-2018 period,
Excess nutrients, such as phosphorus and nitrogen, cause the most problems for the ecology in Irish rivers, so it is important to minimise nutrient losses to water. Irish rivers also face threats from:
- Siltation (suspended particles of sediment in water that clog river beds)
- Invasive alien species (plants or animals that are not native and threaten native species)
- Physical changes (such as dredging)
- Climate change
- Chemical insecticides and herbicides
The ecological status of rivers in Ireland
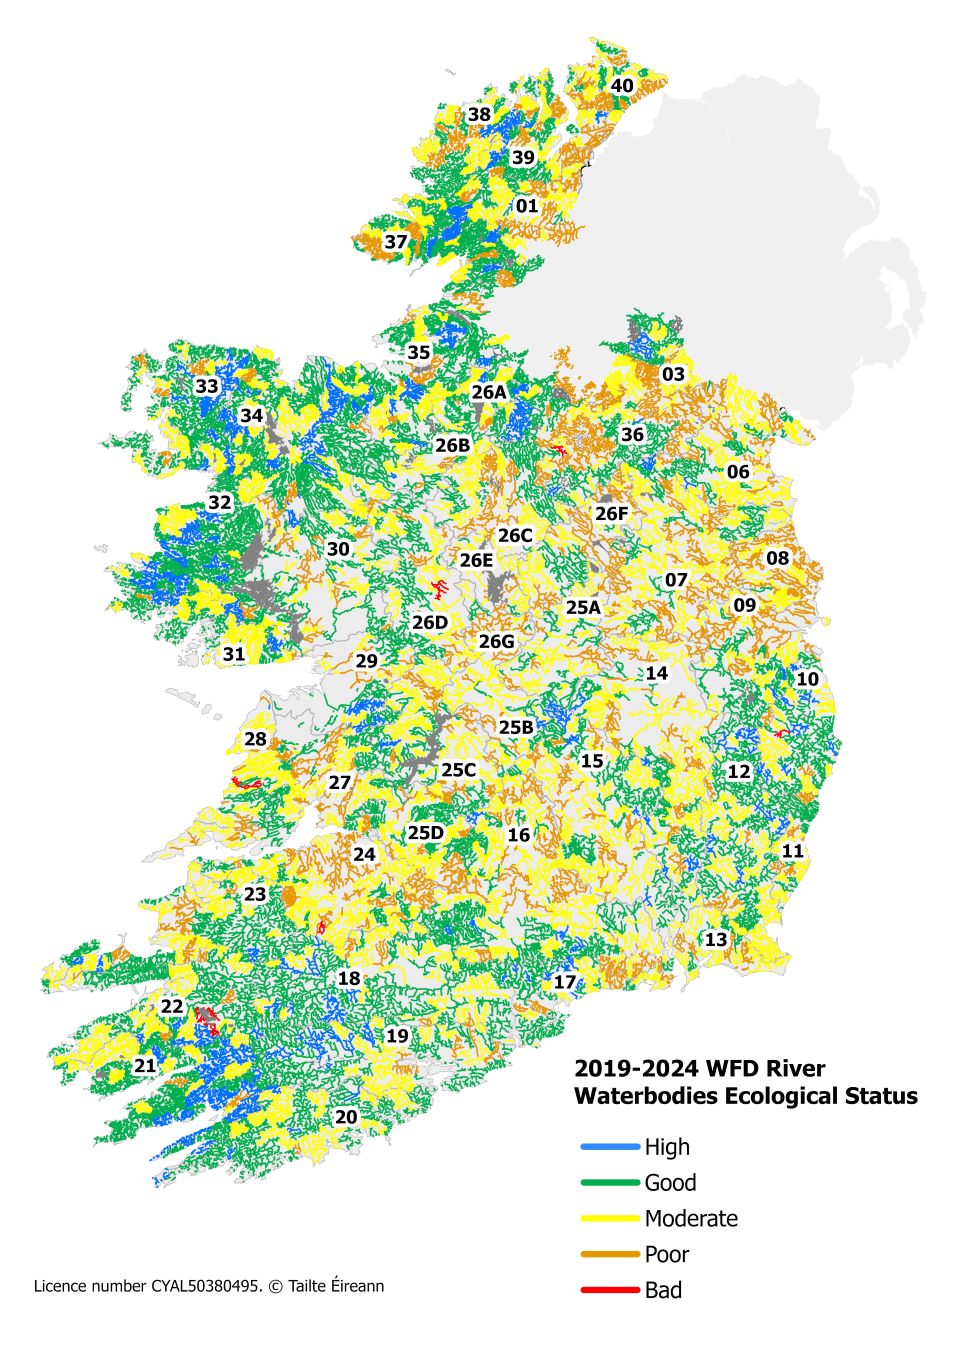
The ecological status of rivers in Ireland 2016 to 2021 with hydrometric areas numbered.
You can also download results from our assessments by hydrometric area here.
See more about river water quality and environmental pressures on:
Catchments.ie
Catchments.ie shares science and stories about our waters. This includes the Catchments Newsletter, detailed assessments for our 46 catchments and 583 sub catchments, downloadable chemistry data, and dashboards for an overview of status, pressures, impacts and objectives.
.webp)
EPA Maps
EPA Maps enables you to view environmental information interactively on a map. It includes the latest data on water quality.