EPA waste data release 27 November 2023. Latest reference year 2021 (Data subject to Eurostat validation)
Municipal waste is made up of household waste and commercial waste that is similar to household waste. The EPA reports data on how much municipal waste is generated and how it is treated.
Our national municipal waste data releases are based on information compiled in line with European rules. For reporting year 2020, Europe changed those rules and the municipal waste information from 2020 onwards is therefore not directly comparable to earlier data.
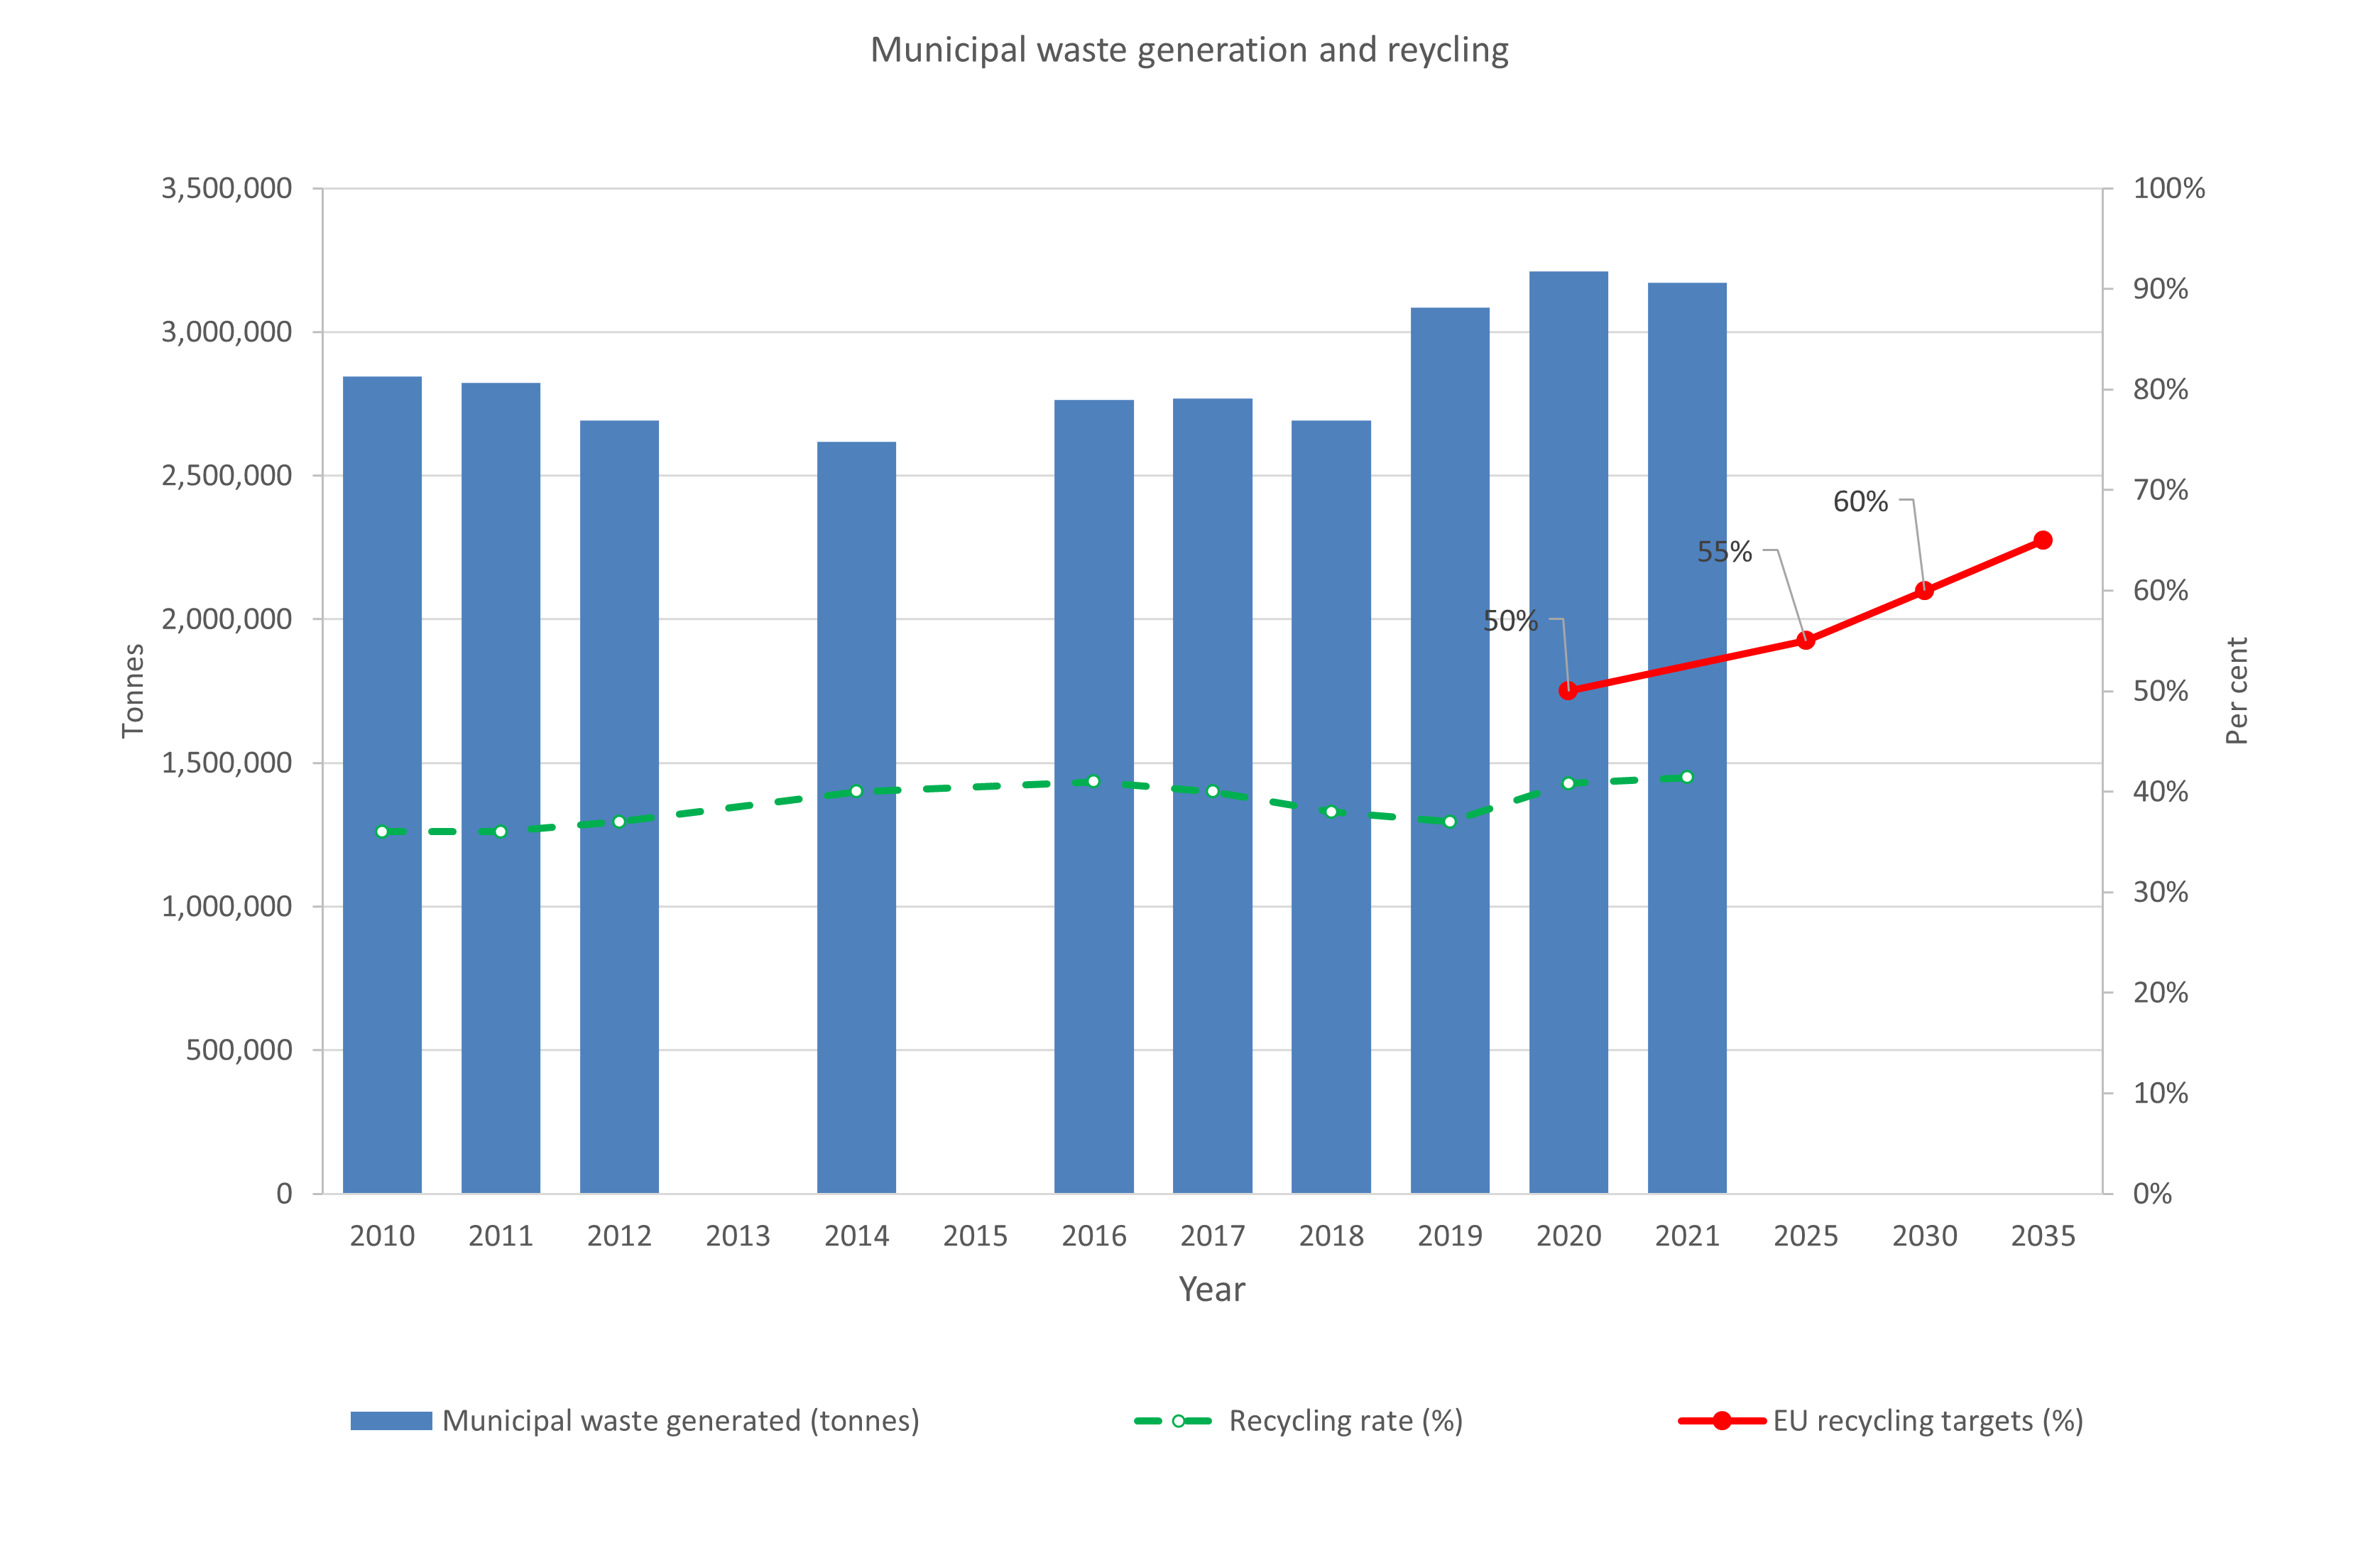
In 2021, Ireland generated 3.17 million tonnes of municipal waste and recycled 41 per cent of it.

In our everyday lives we produce a general mix of waste in our homes, offices, schools and similar premises. This type of waste is called municipal waste. It is usually collected at kerbside or we can bring it to collection centres such as bring banks or civic amenity facilities. The amount of municipal waste generated is an important measure of how wasteful our everyday lives are.
Municipal Waste includes the following waste types:
Table 1. Municipal waste generated, managed and treated in 2021
| Year | Total generated (t) | Recycled (t) | Composted (t) | Incineration with Energy Recovery (R1) (t) | Landfill (D1-7, D12) (t) | Incineration on land (D10) (t) | Unmanaged (t) | Backfill (t) |
| 2021 | 3,170,388 | 824,969 | 487,594 | 1,312,957 | 504,305 | 79 | 25,600 | 14,884 |
| 2020 | 3,210,220 | 959,100 | 351,204 | 1,352,727 | 517,301 | 288 | 29,600 | 0 |
Open in Excel: Table 1: Generation and treatment of municipal waste in 2021 (XLS 10KB)
Open in CSV : Table 1: Generation and treatment of municipal waste in 2021 (CSV 1KB)Table 2 Municipal waste generated by origin
| 2021 | 2020 | |
| Waste generated by households (tonnes) | 1,804,553 | 1,829,825 |
| Waste generated by other sources (tonnes) | 1,365,835 | 1,380,395 |
| Total (tonnes) | 3,170,388 | 3,210,220 |
Open in Excel: Table 2: Municipal waste generated by origin in 2021 (XLS 9KB)
Open in CSV : Table 2: Municipal waste generated by origin in 2021 (CSV 1KB)Table 3. Municipal waste generated by type of waste in 2021, compared with 2020
| 2021 | 2020 | |
| Household and similar waste (tonnes) | 2,698,559 | 2,563,347 |
| Bulky waste (tonnes) | 471,829 | 646,873 |
| Total (tonnes) | 3,170,388 | 3,210,220 |
Open in Excel: Table 3: Municipal waste generated by type of waste in 2021 (XLS 9KB)
Open in CSV : Table 3: Municipal waste generated by type of waste in 2021 (CSV 1KB)Table 4. Export of municipal waste in 2021, compared with 2020
| Total (t) | Recycled (t) | Composted (t) | Incineration with Energy Recovery (R1) (t) | Landfill (D1-7, D12) (t) | Incineration on land (D10) (t) | |
| 2021 | 1,191,086 | 662,554 | 135,502 | 382,042 | 10,908 | 79 |
| 2020 | 1,256,385 | 718,318 | 96,054 | 409,615 | 32,110 | 288 |
Open in Excel: Table 4: Export of municipal waste in 2021 (XLS 17KB)
Open in CSV : Table 4: Export of municipal waste in 2021 (CSV 1KB)Figure 1. Ireland's generation and recycling of municipal waste compared to EU targets.

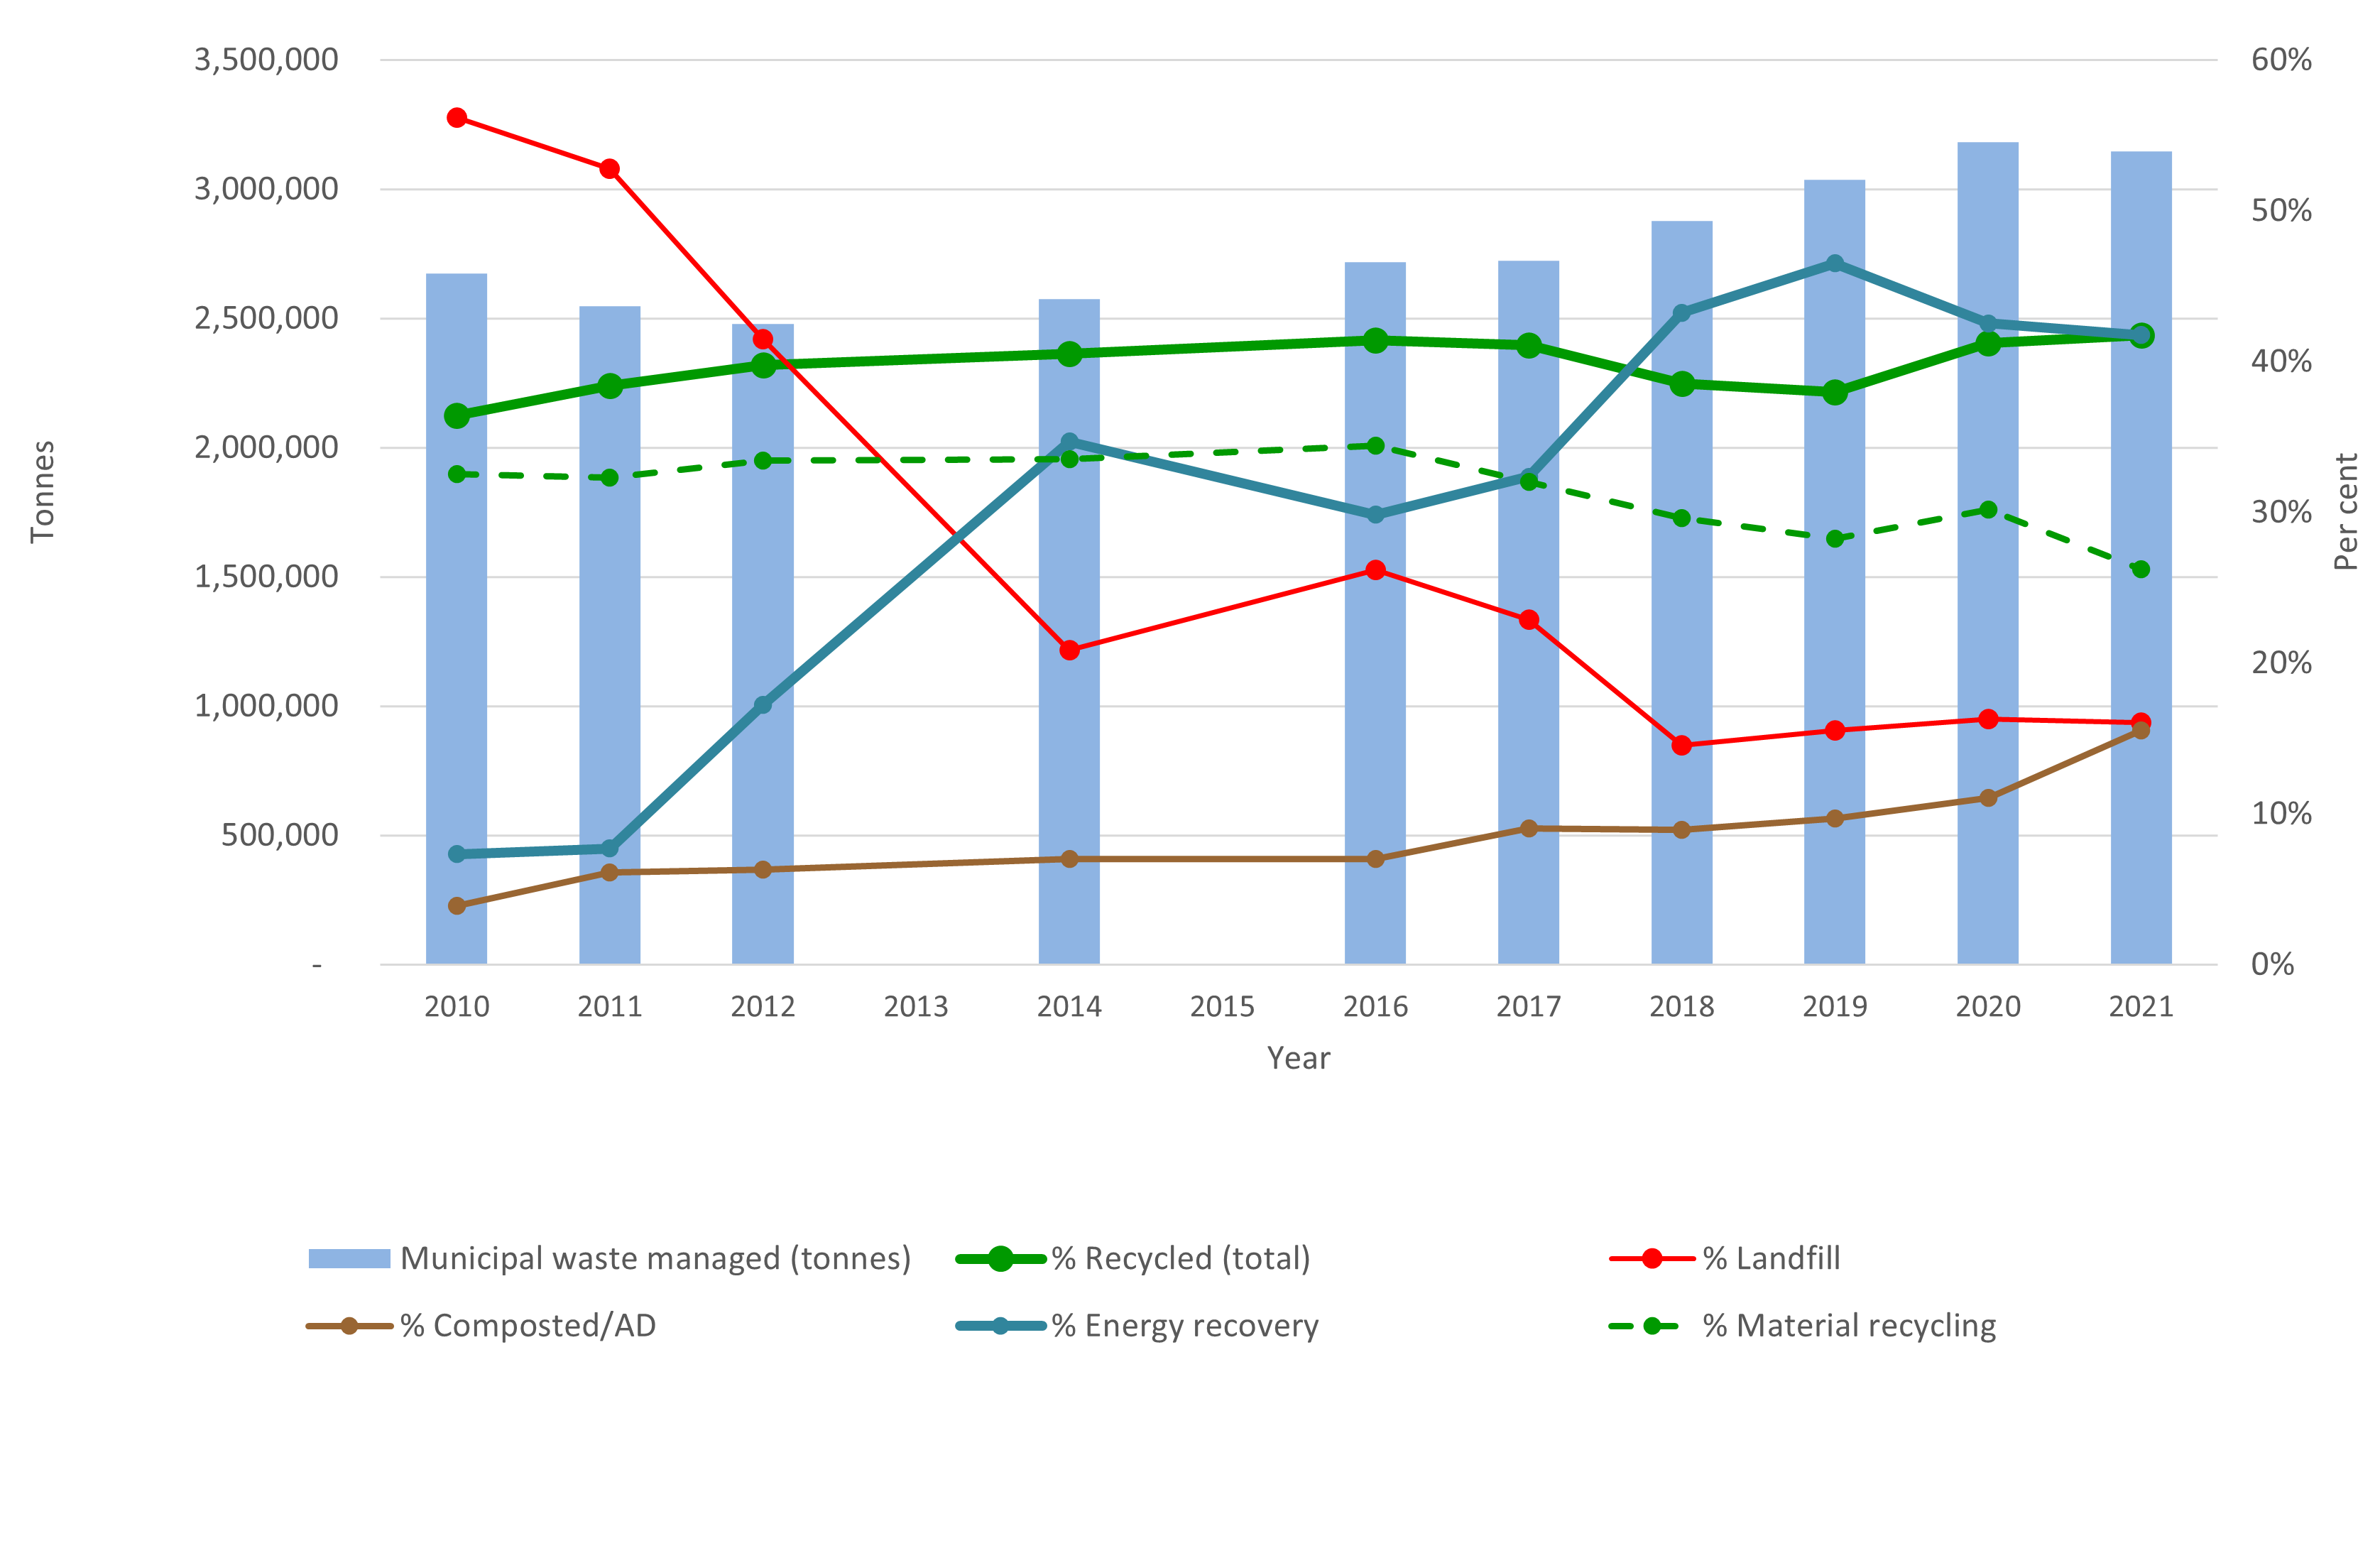
Figure 3. Trends in the management of municipal waste in Ireland, 2010 to 2021.

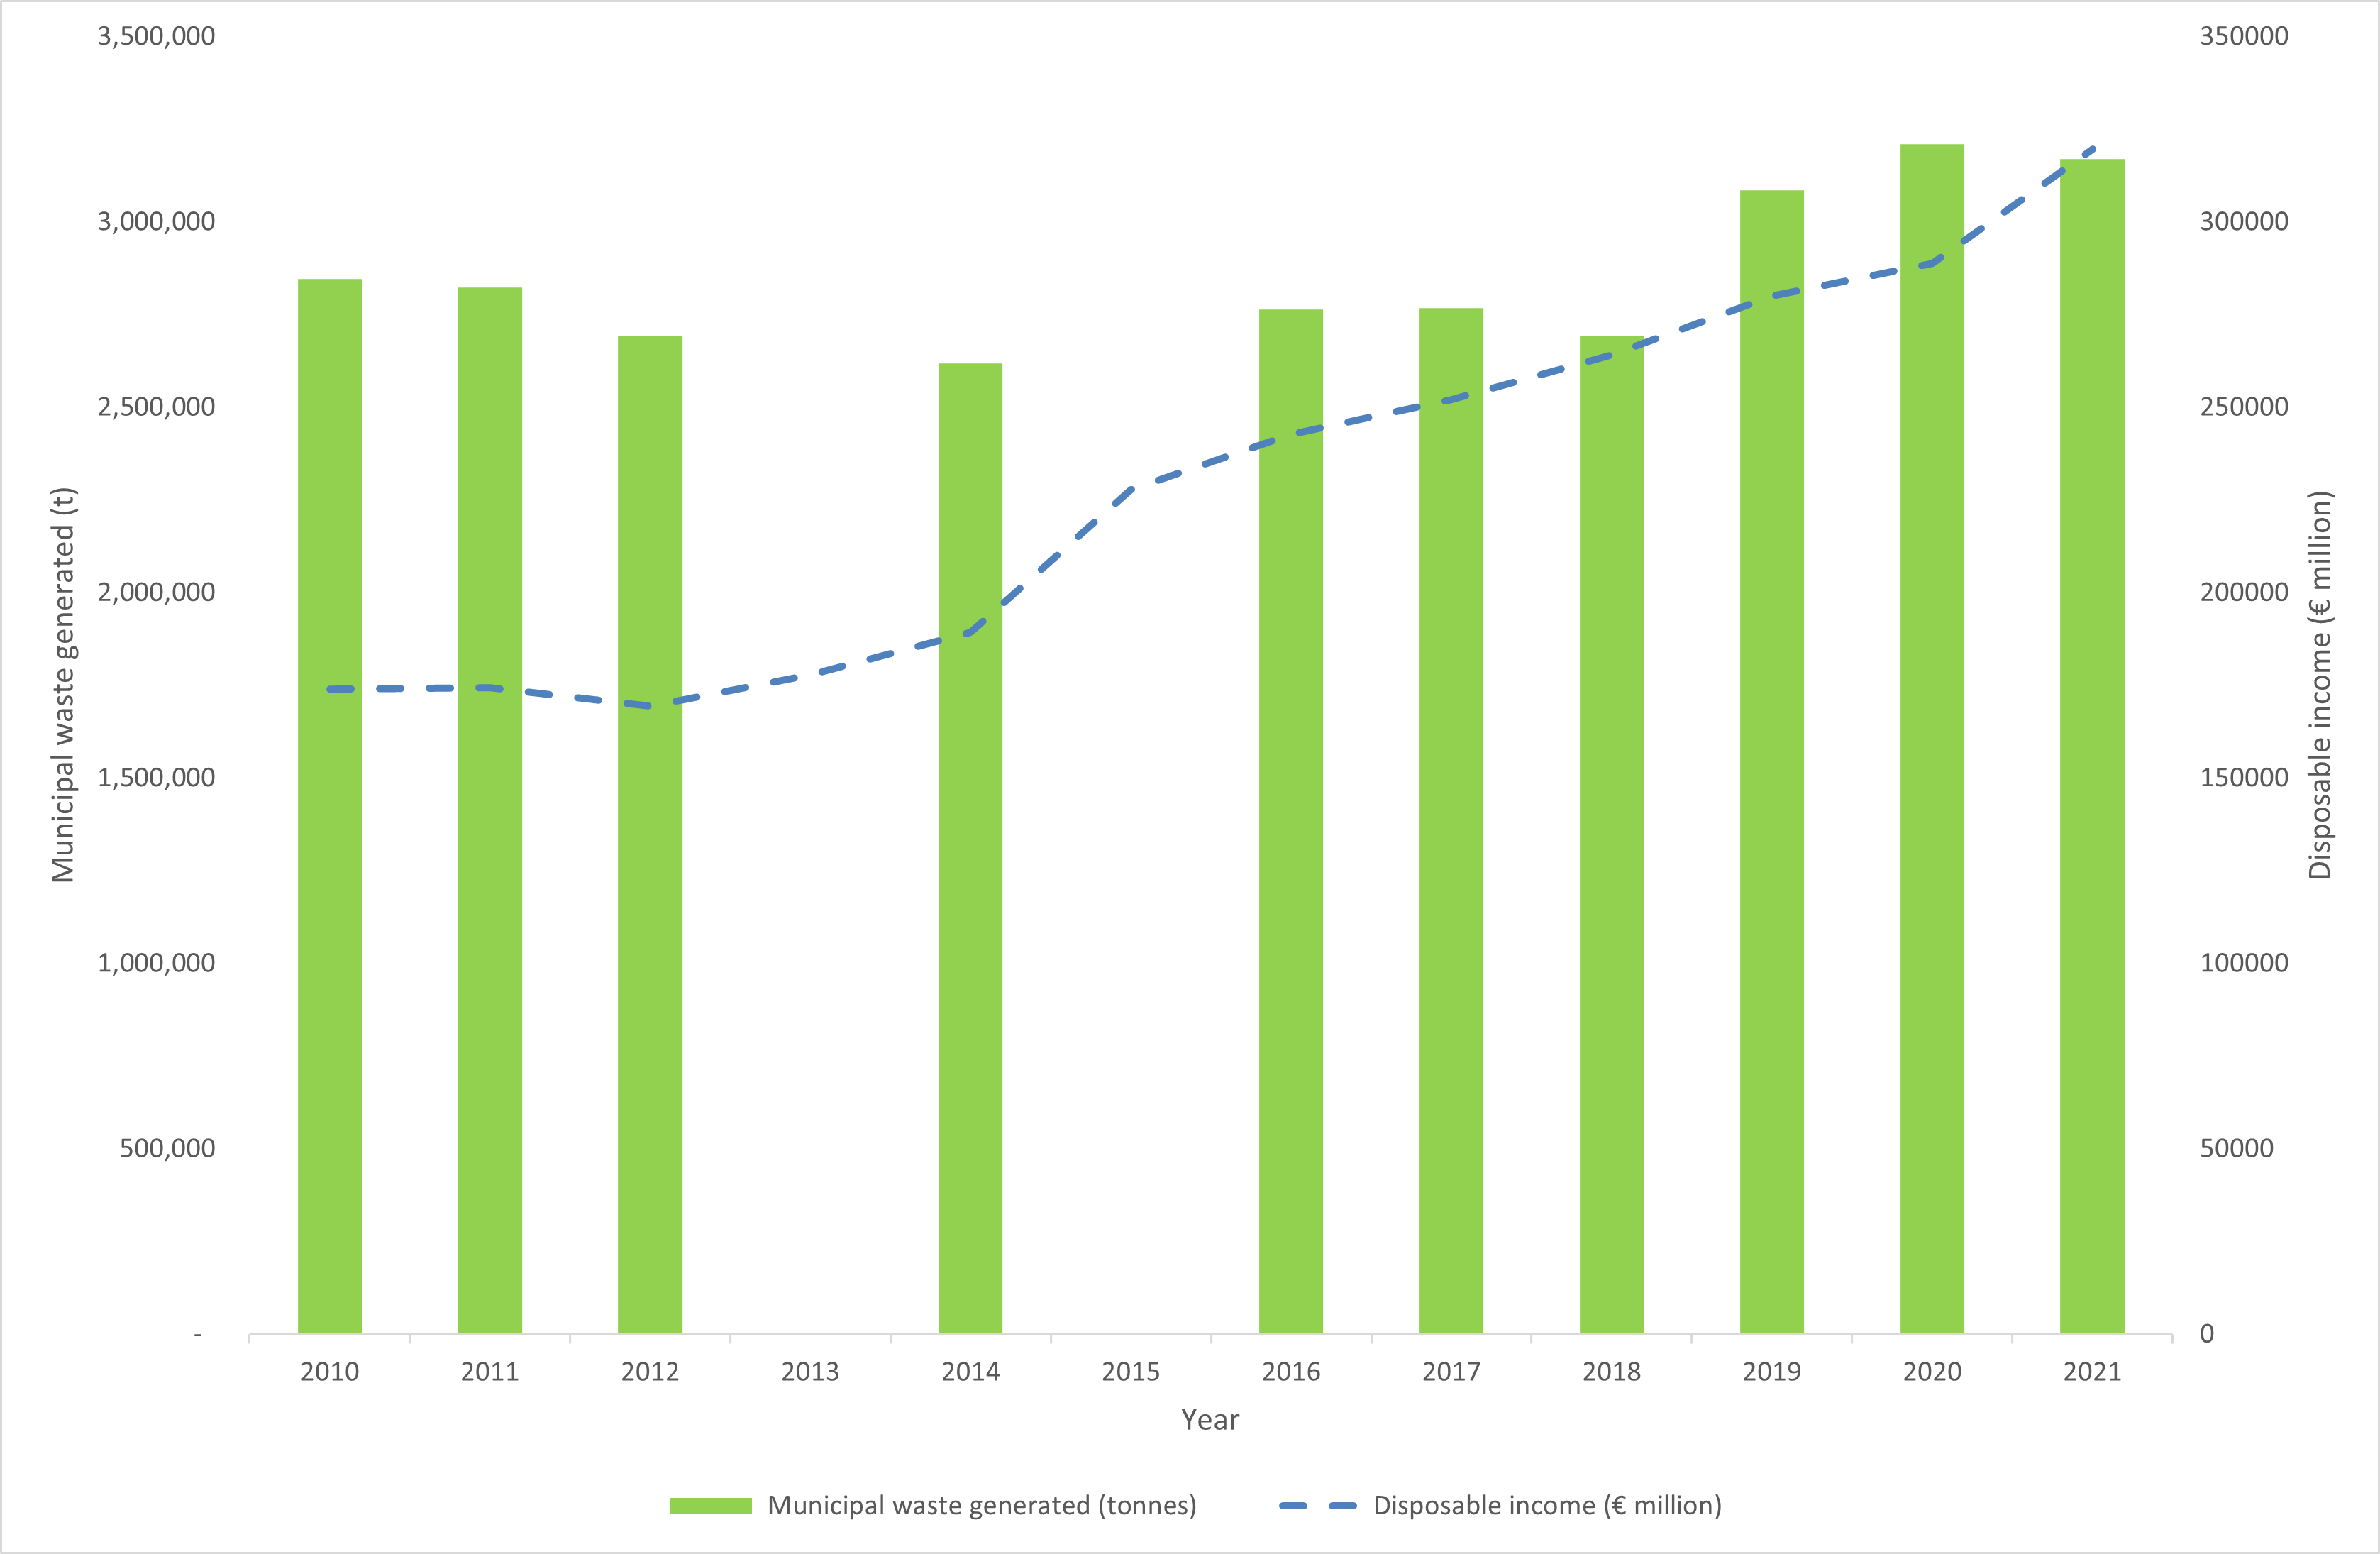
Figure 4. Tonnage of municipal waste generated and gross national disposable income, 2010 to 2021.

The 2021 data highlight the need for implementing policy measures to prevent municipal waste and break the link between economic growth and waste generation. Municipal waste generation grew by over 400,000 tonnes, or 15 per cent, between 2016 and 2021. Correlating trends between municipal waste generation and disposable income (refer to Figure 4) over this period suggest a strong link between economic and waste growth.
The quantity of waste recycled [1] has kept pace with the increases in waste generation, and the rate of recycling has therefore changed little. In 2016 and 2021, recycling in reference to waste generation was at 41 per cent. The gap to the 2025 target is considerable (14 per cent) and cannot be bridged without targeted interventions.
The measures in place to curb municipal waste generation and/or increase recycling include waste treatment levies, waste collection charges, enforcement action, awareness-raising campaigns and education.
Waste composition analysis carried out by EPA in 2022 documents that almost 70 per cent of non-household waste collected in residual bins could be recycled if it had been placed into the recycling or biowaste collection. The introduction of a mandatory incentivised charging system for non-household municipal waste in 2023 incentivises waste reduction and will boost Ireland's recycling percentages.
Our national municipal waste data releases are based on information that is in line with the data we submit to Eurostat (the statistical office of the European Union) to fulfil our municipal waste reporting obligations. For reporting year 2020, Eurostat changed the reporting rules for municipal waste. The Irish information published in 2019 and earlier years is therefore not directly comparable to the information released from reporting year 2020 on.
The data we submit to Eurostat satisfy our reporting requirements under the Waste Framework Directive, the Landfill Directive and the OECD/Eurostat Joint Questionnaire. The data are to be submitted at the end of Q2 of the reference year +2. Following validation by Eurostat, official statistics for Ireland and all Member States are published on the Eurostat website as part of the ‘Municipal waste by waste management operations’ dataset. Data on municipal waste recycling rates for Member States are also published on the Eurostat website.
View information about how the EPA compiles and reports Official European Waste Statistics.
[1] This includes preparing for reuse, material recycling, and composting/anaerobic digestion of biowaste.
[2] The recycling and preparing for reuse percentages under the revised WFD are set to increase to 55 per cent from 2025, 60 per cent from 2030 and 65 per cent from 2035.
[3] Including preparing for reuse and material recycling.